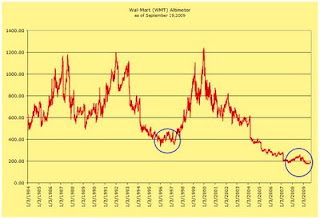
Based on the above chart, we can see that WMT is traditionally overvalued between 1100 and 1200 level. Additionally, when WMT falls to the 550 level the company is considered undervalued. What should be noticed is the double bottom that took place in the 1995 to 1997 period. After that time, WMT took off like a rocket.
In the most recent period from 2007 to 2009, we can see that WMT is forming a similar double bottom. From this indication, we should look out for the stock to rise significantly over the next four years. The expected rise in WMT should be in spite of all the economic forecasts of a continued decline in the economy.
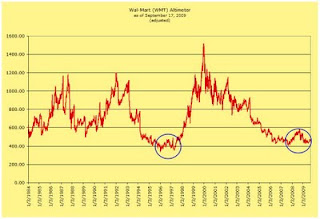
The chart below is my own interpretation of WMT if the company pursued a less aggressive policy of increasing the dividend at such a high rate.
 In the first chart, you can see that after 2004 WMT fell to an extreme level of undervaluation. The reason this occur is because WMT continued in increase the dividend at a high rate even though the company didn't have the earnings to support such increases. With diminished earnings, WMT issued more shares to raise capital to fund the dividend payments at the expense of per share earnings.
My model continues to increase the dividend every year but at a rate of 50% less than what WMT did from the period of 2004 to the present. This lowers the number of shares that need to be issued. In fact, my model would not have required the issuance of new shares to cover the dividend.
At the moment, we could consider WMT undervalued. However, keep in mind the fact that the continued issuance of shares in order to keep the dividend history intact undermines future earnings growth.
related article:
