On June 6th, Richard Russell wrote an article on the Financial Sense website titled “Are We Fated to Live 1929-1930 All Over Again?” In that article, Russell discussed the Barron’s Monthly Index of Physical Volume of Industrial Production [BMIPVIP] reflecting on the movements of the index as compared to the Dow Jones Industrial Average in the period from the peak of the stock market in 1929 to the bottom in 1932.
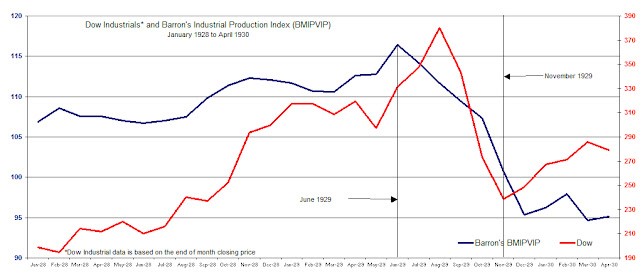
Richard Russell pointed out that from November 1929 Barron’s Monthly Index of Physical Volume of Industrial Production [BMIPVIP] gave ample warning that the direction of the U.S. economy was still headed lower despite the rebound of the Dow Jones Industrial Average from November 1929 to April 1930 as depicted in the chart below.
 |
| Source: Persons, Warren. Barron's. May 15, 1933; pg. 18 |
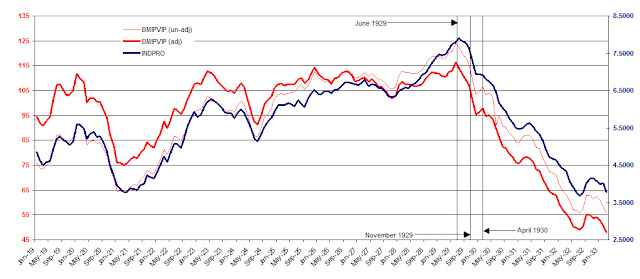
Because the BMIPVIP was discontinued in 1938, we’ve used the closest approximation which is the Federal Reserve’s Industrial Production Index (INDPRO) found at the St. Louis Federal Reserve website. In order to make a comparison to the two indexes, we checked the performance of the INDPRO to the BMIPVIP. Below is the chart of the Barron’s adjusted and unadjusted BMIPVIP index and the Federal Reserve’s INDPRO from 1919 to 1933.
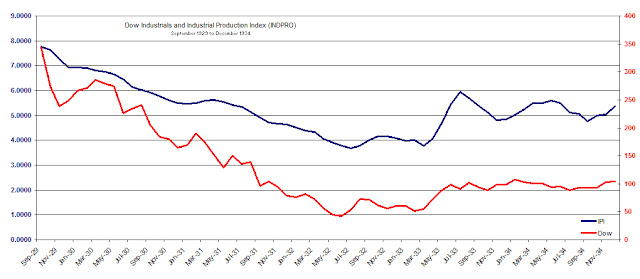
It can clearly be seen that the Federal Reserve’s index (INDPRO), which is still in use today, can be used to measure against the Dow Jones Industrial Average. Whenever the Barron’s index zigged the Fed’s index zigged, whenever the Barron’s index zagged so too did the Fed’s index. We believe that using the Fed’s Industrial Production Index is the best and most consistent approximation to compare to 1929 to 1934 (shown below) as well as today’s market.
 |
| source: Person, Warren. Barron's. May 15, 1933. pg. 18. |
According to Russell, the BMIPVIP hit its high in the month of June 1929. This was a full 3 months before the peak in the Dow Industrials in September 1929. The Federal Reserve index actually peak in July 1929 however, this was still ample enough time to gain inferences from the index’s movement.
Russell correctly observed that the BMIPVIP was critical in the evaluation of whether or not the economy and the stock market were on a rebound. The great Dow Theorist Robert Rhea first introduced the use of Barron’s Industrial Production Index in his book Dow’s Theory Applied to Business and Banking. Rhea used BMIPVIP as a means to confirm the signal provided by Dow Theory which contributed to his accurate call of a market bottom in July 1932.
Richard Russell’s point was that even though the stock market rallied strongly after the initial crash from the September 1929 high to the November 1929 low, the subsequent rebound was unsustainable when viewed from the perspective of the BMIPVIP or the INDPRO. Unfortunately for Russell, his analysis of the BMIPVIP index and the Dow Jones Industrial Average comes to the wrong conclusion when attempting to bring actions of the past to market activity of the present.
Russell closes his article with the following thoughts:
“After April 1930, the post-crash rally ended, and a great bear market began. As the market turned down again, the US economy crumbled. By July 1930, Barron's Index of Industrial Activity had fallen to 85.5. The Great Depression was on.
“And I'm wondering about the comparison with today's action. Recently, we've seen the Dow climbing steadily from its March 2009 low, all the while with the economy neutral to weak. Then we see the Dow hitting a high last month in May with business today sluggish and even weaker than it was in January.
“And I'm wondering, ‘Are we fated to live 1929-1930 all over again?’ Is the stock market rally of March 2009 to May 2011 a repeat of the stock market rally of November 1929 to April 1930? In both instances, business weakened as the market climbed higher.
“But the scary part is that in 1930 when the Dow broke support, the Great Depression began and Barron's Business Index continued to plunge. Let's keep an eye on the March 2011 lows -- Dow......11613.30 and Transports ....4950.17.”
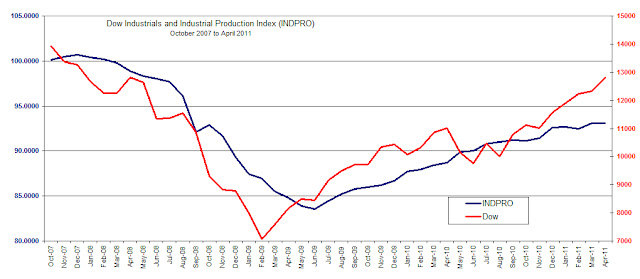
We’re disappointed that Russell’s remarks are uninformed and misleading with the intent of creating fear. First, Russell withholds the data necessary to test whether his assessment is accurate. Next, Russell implies that the Dow Industrials of today may be rising in spite of the Industrial Production Index falling. However, the Fed’s INDPRO has been in perfect alignment with the rise of the Industrial Average since 2007 as shown in the chart below.
Finally, Russell closes his article with an attempt at drawing the events of the past to the present. Russell's effort lacks all substance when he speaks of targets for the Dow Industrials to watch for but doesn't introduce the Industrial Production Index nor it's relationship to 1929 and today.
While the true test may come when the Dow Industrials and Industrial Production Index (INDPRO) attempt to exceed the prior high of 2007, there is little indication that Russell’s assessment is correct.
Please consider donating to the New Low Observer. Thank you.


