At the end of the week, our watch list contains 29 companies. Here is the watch list which ranks current and former Dividend Achievers that are within 20% of the 52-week low for April 30, 2010. Instead, they are the starting point for doing your research and determining the best company to buy. Ideally, a stock that is purchased from this list is done after a considerable decline in the price and extensive due diligence.
| Symbol | Name | Price | % Yr Low | P/E | EPS | Div/Shr | Yield | Payout Ratio |
| MON | Monsanto Co. | 63.06 | 1.40% | 26.28 | 2.40 | 1.06 | 1.68% | 44% |
| XOM | Exxon Mobil Corp. | 67.77 | 6.62% | 17.03 | 3.98 | 1.68 | 2.48% | 42% |
| LLY | Eli Lilly and Co. | 34.97 | 8.64% | 9.01 | 3.88 | 1.96 | 5.60% | 51% |
| FRS | Frisch's Restaurants, Inc. | 21.91 | 10.05% | 11.07 | 1.98 | 0.52 | 2.37% | 26% |
| SHEN | Shenandoah Telecom | 17.76 | 10.31% | 27.75 | 0.64 | 0.32 | 1.80% | 50% |
| DNB | Dun & Bradstreet Corp. | 76.97 | 11.39% | 12.83 | 6.00 | 1.40 | 1.82% | 23% |
| FII | Federated Investors, Inc. | 24.12 | 11.67% | 12.31 | 1.96 | 0.96 | 3.98% | 49% |
| T | AT&T Inc. | 26.06 | 12.38% | 12.97 | 2.01 | 1.68 | 6.45% | 84% |
| WMT | Wal-Mart Stores, Inc. | 53.64 | 13.28% | 14.50 | 3.70 | 1.21 | 2.26% | 33% |
| UHT | Universal Health Realty | 33.22 | 14.20% | 21.43 | 1.55 | 2.40 | 7.22% | 155% |
| FPL | FPL Group, Inc. | 52.05 | 14.93% | 13.11 | 3.97 | 2.00 | 3.84% | 50% |
| THFF | First Financial Corp. | 29.15 | 15.08% | 16.85 | 1.73 | 0.90 | 3.09% | 52% |
| FFIN | First Financial Bankshares, Inc. | 53.48 | 15.11% | 20.73 | 2.58 | 1.36 | 2.54% | 53% |
| CWT | California Water Service | 38.73 | 15.65% | 19.86 | 1.95 | 1.19 | 3.07% | 61% |
| HSC | Harsco Corp. | 30.96 | 16.00% | 21.06 | 1.47 | 0.82 | 2.65% | 56% |
| VIVO | Meridian Bioscience Inc. | 19.99 | 16.76% | 25.30 | 0.79 | 0.76 | 3.80% | 96% |
| VVC | Vectren Corp. | 25.01 | 16.92% | 15.25 | 1.64 | 1.36 | 5.44% | 83% |
| TMP | Tompkins Financial Corp. | 40.62 | 17.24% | 13.45 | 3.02 | 1.36 | 3.35% | 45% |
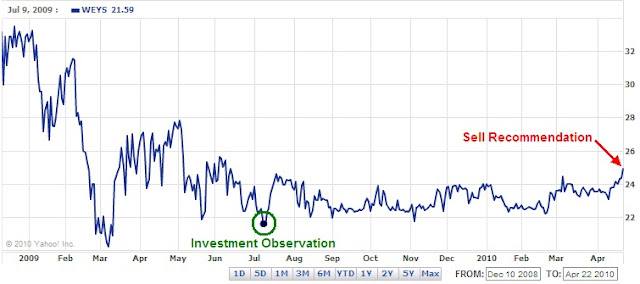
| WEYS | Weyco Group, Inc. | 24.44 | 17.39% | 22.02 | 1.11 | 0.60 | 2.45% | 54% |
| SFNC | Simmons First National Corp. | 28.08 | 17.49% | 17.12 | 1.64 | 0.76 | 2.71% | 46% |
| NTRS | Northern Trust Corp. | 54.98 | 17.68% | 17.29 | 3.18 | 1.12 | 2.04% | 35% |
| HCC | HCC Insurance Holdings, Inc. | 27.19 | 18.11% | 8.74 | 3.11 | 0.54 | 1.99% | 17% |
| PGN | Progress Energy Inc. | 39.92 | 18.28% | 14.73 | 2.71 | 2.48 | 6.21% | 92% |
| NUE | Nucor Corp. | 45.32 | 18.42% | -188.83 | -0.24 | 1.44 | 3.18% | -600% |
| WTR | Aqua America, Inc. | 18.33 | 19.10% | 23.81 | 0.77 | 0.58 | 3.16% | 75% |
| OTTR | Otter Tail Corp. | 22.22 | 19.27% | 31.30 | 0.71 | 1.19 | 5.36% | 168% |
| ADM | Archer-Daniels-Midland | 27.94 | 19.50% | 15.70 | 1.78 | 0.60 | 2.15% | 34% |
| NWN | Northwest Natural Gas Co. | 47.39 | 19.58% | 16.75 | 2.83 | 1.66 | 3.50% | 59% |
| BEC | Beckman Coulter, Inc. | 62.40 | 20.77% | 28.62 | 2.18 | 0.72 | 1.15% | 33% |
| 29 Companies | ||||||||
Watch List Summary
The best performing stock from last week's list was FPL Group (FPL) which rose 1.5%. The worst performing stock was Federated Investors (FII) which fell 6.9%. Overall, the Dividend Achiever watch list lost 1.8% versus the Dow which was down 1.75%.
No two ways about it, stocks got crushed. Monsanto (MON) continued to remain weak but the technical outlook turned rather positive when RSI diverge from the price. We'll have to see if this produce a short term rebound in price. Additionally, two positive notes came from Exxon (XOM) and Weyco (WEYS) which announced dividend increases.
Once again, the key to this list isn't to provide a winner but collectively, we hope that it can be a starting point for you to research these companies and hopefully provide lower volatility, margin of safety and provide marginally higher return than the general market.
Related Links:
Email our team here.