Monthly Archives: April 2010

Dividend Achiever Watch List

At the end of the week, our watch list contains 26 companies. Here is the watch list which ranks current and former Dividend Achievers that are within 20% of the 52-week low for April 9, 2010.

Symbol Name Price % Yr Low P/E EPS Div/Shr Yield Payout Ratio
MON Monsanto Co. 68.85 3.42% 24.78 2.78 1.06 1.54% 38%
DNB Dun & Bradstreet Corp. 74.49 7.80% 12.42 6.00 1.40 1.88% 23%
XOM Exxon Mobil Corp. 68.76 8.18% 17.28 3.98 1.68 2.44% 42%
TMP Tompkins Financial Corp. 37.55 8.38% 12.69 2.96 1.36 3.62% 46%
FPL FPL Group, Inc. 49.71 9.76% 12.53 3.97 2.00 4.02% 50%
WEYS Weyco Group, Inc. 23.31 11.96% 21.00 1.11 0.60 2.57% 54%
BRO Brown & Brown, Inc. 18.30 12.13% 16.94 1.08 0.31 1.69% 29%
FFIN First Financial Bankshares 52.82 13.69% 20.47 2.58 1.36 2.57% 53%
CWT California Water Service 38.08 13.71% 19.53 1.95 1.19 3.13% 61%
T AT&T Inc. 26.44 14.01% 12.48 2.12 1.68 6.35% 79%
LLY Eli Lilly and Co. 36.84 15.20% 9.35 3.94 1.96 5.32% 50%
SHEN Shenandoah Telecom 18.56 15.28% 29.00 0.64 0.32 1.72% 50%
THFF First Financial Corp. 29.24 15.44% 16.90 1.73 0.90 3.08% 52%
UMBF UMB Financial Corp. 42.15 15.99% 19.16 2.20 0.74 1.76% 34%
SFNC Simmons First National 27.74 16.07% 15.94 1.74 0.76 2.74% 44%
WMT Wal-Mart Stores, Inc. 55.07 16.30% 14.88 3.70 1.21 2.20% 33%
WTR Aqua America, Inc. 17.92 16.44% 23.27 0.77 0.58 3.24% 75%
AROW Arrow Financial Corp. 26.77 16.74% 13.45 1.99 1.00 3.74% 50%
PGN Progress Energy Inc. 39.17 16.93% 14.45 2.71 2.48 6.33% 92%
SYBT S.Y. Bancorp, Inc. 23.16 16.97% 19.46 1.19 0.68 2.94% 57%
OTTR Otter Tail Corp. 21.87 17.39% 30.80 0.71 1.19 5.44% 168%
NWN Northwest Natural Gas Co. 46.88 18.44% 16.57 2.83 1.66 3.54% 59%
MLM Martin Marietta Materials 87.51 18.61% 45.82 1.91 1.60 1.83% 84%
HCC HCC Insurance Holdings 27.31 18.64% 8.78 3.11 0.54 1.98% 17%
CTWS Connecticut Water Service 23.18 20.04% 19.48 1.19 0.91 3.93% 76%
SBSI Southside Bancshares, Inc. 20.99 20.70% 7.44 2.82 0.65 3.10% 23%
26 Companies

Watch List Summary 
The best performing stock from last week's list is American State Water (AWR) which rose 7.4%. The worst performing stock is Monsanto (MON) which fell 2.8%. Overall, the Dividend Achiever watch list gained 1% versus the Dow gained of 0.63%.


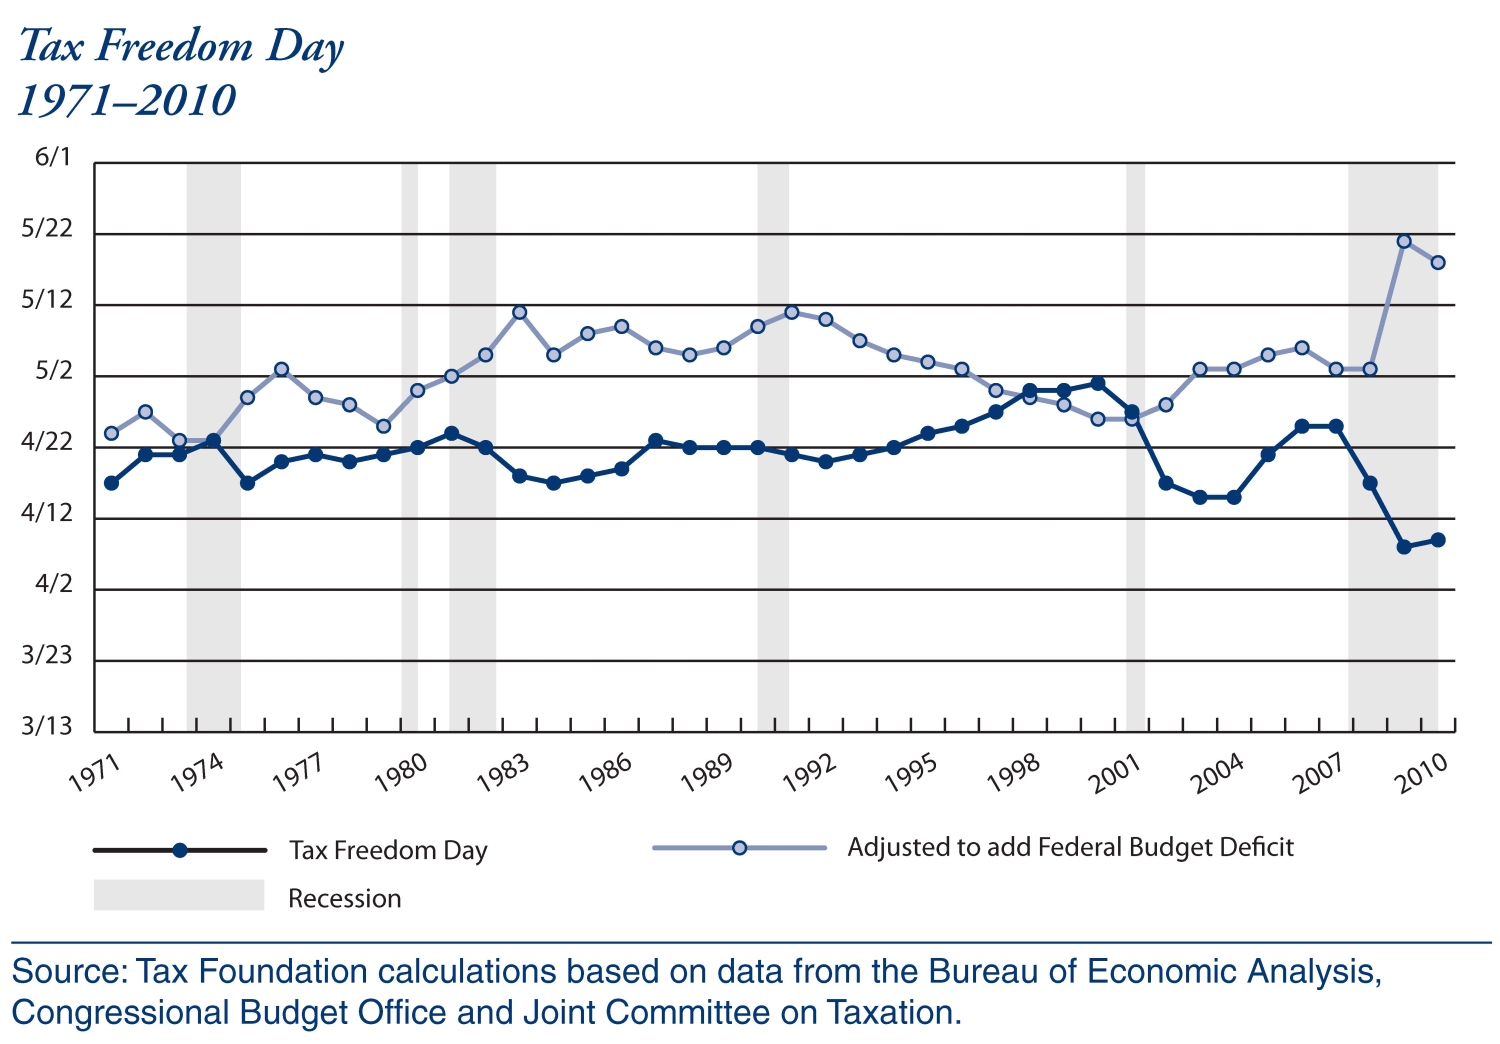
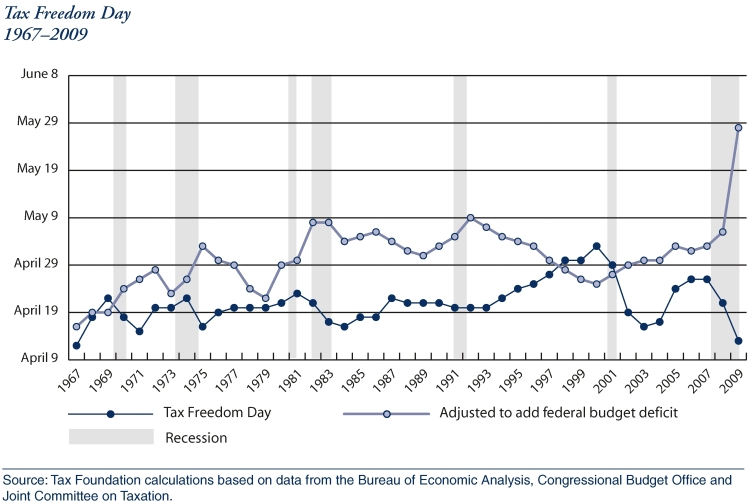
You may have noticed that this list is full of utility (Electricity, Gas, and Water) companies. Recently, a reader asked for our opinion on FPL Group (FPL). We replied under Research Request and urged anyone interested in investing in utilities carefully examine the sector. Although we are long California Water (CWT), we are not too excited about this sector due to the eventual rise in interest rates. Many people, myself included, may not remember the 70's (I wasn't even born yet) but our studies have shown that undervalue utilities became a bigger bargain when interest rate rose. Companies with dividend yields of 5% quickly became 10% as the price collapsed. The excerpt below was taken from my commentary on Seeking Alpha
Utilities got CRUSHED in the 70's when actual inflation came. Take a look at ED which traded at $5 at the end of 1974. Once year later the stock was just north of $2. It didn't reach $5 until end of 1977.AEP is another example. It closed 1974 at $26. It hit a low of $14 toward the end of 1975 and later closed the year at $18. It didn't get truly above $26 level until 1986.CNP is another name that got clobbered in 1973 to 1975.FPL didn't start trading until 1983 which saw the beginning of rate decline. The Fed Fund rate shot up to 12.9 in July 1974, came down and went back up to 14.94 in April 1982.Anyone interested in investing in Utilities, should study what really happen to cost of borrowing for these companies when rate rose.
- Art
Email our team here.

Embracing the Economic "New Normal"

According to the Tax Foundation, Americans paid their portion of the Federal tax bill, as measured in number of days out of 365, on April 9th. This was one day later than in 2009. The reason for the reduction in the number of days needed to pay our portion of taxes since 2007 is because of all the stimulus and bailouts that have occurred since the onset of the financial "crisis."
  
If we review the chart on the number of days Americans achieved their "Tax Freedom Day," we find that during years with economic growth we take longer to obtain our freedom. The government sticks it to us when we're making more money. Notice also that our federal budget deficit has gone parabolic for the very same reason that our annual tax bill has gone down.

I've always maintained that this bear market resembles the secular bear period from 1966 to 1982. The chart shows a shocking resemblance between the two periods. In 1968, Tax Freedom Day took place later than the date for the deficit. Likewise, in 1999, freedom occurred after the date for the deficit. After the crossover took place in 1968, our economy hit the high inflation skids thereafter.

For good reason, the 2009 parabolic move in the deficit scares me plenty. If the past is any indication of the future then we're gonna get rampant inflation like never before seen. The irony of this is that after getting slammed in stocks and real estate, most people are seeking safety above all else. The most obvious target for safety is a bank with deposit insurance. Unfortunately, the reformed saver (formerly known as an investor) will get crushed in the coming inflation.
"Markets have risk. So does a savings bank when inflation runs rampant."
Richard Russell. Dow Theory Letters. October 7, 1958. page 2.
What is likely to occur is that the same people who got beaten down in real estate and stocks will get nothing less than clobbered when they are locked in a 6-month certificate of deposit at a local bank. Those with the cash will be reluctant to buy real estate or the "right" stocks. Utility stocks will be the favored choice for "safety" but the unsuspecting will wish they never heard of utility companies as a "safe" investment. Even my favorite Dividend Achievers will be taking it on the chin during high inflation.

My solution to the coming inflation is to embrace it. One way to do this is to read Is Inflation Ending? Are You Ready? This book was written in 1982 by Gary Schilling and Kiril Sokoloff (published in 1983) explaining why the days of double digit inflation were over. This is important because everything that happened after 1983 can easily be verified. In the book, we get insight as to what happens in a deflationary environment which precedes breakneck inflation. In order to understand where we're going we need to know where we came from, the book by Schilling and Sokoloff covers 60% of the high/low inflation equation.

Next, read the book Crisis Investing by Douglas Casey. Casey's book covers all ends of the investment spectrum with a bias towards high inflation environments. While you might not need half of the strategies that are mentioned, Crisis Investing will come in handy when you need a quick reference.

Research Request: FPL Group (FPL)

The research request that we've received is from Brian out of Austin, Texas who asks what our thoughts on FPL Group (FPL) might be.  According to Value Line Investment Survey, "FPL Group, Inc. is a holding company for Florida Power & Light (FPL), a utility engaged in the generation, transmission, distribution, and sale of electricity to 4.5 mill. customers in a 27,650-sq.-mi. area in eastern & southern Florida. NextEra Energy Resources is a nonregulated power generator with nuclear, gas, & wind ownership."
At the forefront of the concerns for FPL Group (FPL)  is the recent rejection by state regulators for a rate increase.  On January 14, 2010, FPL Group (FPL) was turned down for the requested rate increase of $1 billion in 2010 and $250 million in 2011.  As bad as this seems for FPL Group (FPL) the decline in the stock price seemed to have anticipated the outcome with the peak of the price on December 11, 2009 at $56.25.  After December 11th, the stock of FPL Group (FPL) fell to $51.50 the day before the rate decision came due.  In my estimation, any decline in the price of FPL after the decision was simply reactionary on the part of speculators who were caught on the wrong side of the trade.  FPL fell to its lowest point at $45.57 and has risen steadily since.
According to Dow Theory, FPL has the following upside targets (based on the peak of $72.56 on December 5, 2007 and the decline to $37.08 on October 10, 2008.):
  • $48.90
  • $60.73
  • $72.56
FPL has the following downside targets (based on the February 2, 2000 low at $18.41 to the peak of $72.56):
  • $45.48
  • $36.43
  • $27.42
  • $18.41
Of particular concern to me is the fact that we are in the 5th year of an inflationary cycle.  As noted in the right hand column of our website, inflation seems to have a 50-year full cycle which according to Dewey and Dakin's book Cycles: The Science of Prediction, would have begun in 2005/2006.  It is important to note that Dewey and Dakin's book was published in 1947 and indicated the subsequent peaks and troughs in the inflation rates since.   The impact of this thesis is quite relevant to FPL Group (FPL) and all utility companies since they rely almost exclusively on borrowing to fund their current and future operations.  The higher their borrowing costs the more the impact to the company's earnings.

With the aforementioned interest rate issues in mind, I would like to reference Investment Quality Trends view that FPL Group (FPL) is considered undervalued when the stock has a dividend yield of 9%.   With the current annual dividend of $2, FPL Group (FPL) would be selling for $22.22 if yielding 9%.  If we were to assume that FPL Group (FPL) were to fall between the current yield of 4.10% and 9%, the FPL Group (FPL) would fall to the level of $30 when yielding 6.5%.  These estimates to the downside should be paramount to the consideration of the investment in utilities.  What concerns me the most with utilities is the prospect of a decline similar to the period from 1965 to 1974.  In that period, the yield on the Dow Jones Utility Index went from 3% all the way up to 12% (Source: Weiss, Geraldine, Dividends Don't Lie, Longman, 1988).
 
According to Value Line Investment Survey, FPL normally trades around 1.34 times the per share dividend divided by the "interest rate" (1.34x $2/interest rate). Valueline doesn't tell us by which interest rate we should apply to the company, so I have decided to apply the 30, 20, and 10 year U.S. Treasury rate. The following are the mean prices that FPL would trade at for each interest rate scenario:

  • 30-year rate- $55.71
  • 20-year rate- $57.63
  • 10-year rate- $67.68

Based on the 30 year rate, FPL is selling 14.84% below the historical mean value. I chose the $55.71 value since it was the most conservative figure.

Considering all the issues that are present in an increasing interest rate environment going forward, we're going to take a look backwards and examine the fundamentals of FPL Group (FPL).  According to Morningstar.com, FPL is selling 28.5% below the average P/E over the last 10 years.  In terms of the price-to-book ratio, FPL is selling 29.33% below the 10-year average.  The extremes based on the 10-year average for FPL are that the stock is selling 14% below the average based on a price-to-sales ratio and 57% below the average on a price to cashflow basis over the same period.

Again, my concern with the fundamental data on utilities since 1980 is that it is based on a falling interest rate environment which is highly favorable to borrowers.  The opposite should be true in what I believe lies ahead for interest rates.  If I were to invest in this stock, I would buy, as my limit, only half of my normal position and no more.
Email our team here.

Dividend Achiever Watch List

At the end of the week, our watch list contains 26 companies. Here is the watch list which ranks current and former Dividend Achievers that are within 20% of the 52-week low for April 1, 2010.
 
Symbol Name Price % Yr Low P/E EPS Div/Shr Yield Payout Ratio
TMP Tompkins Financial Corp. 36.52 5.41% 12.34 2.96 1.36 3.72% 46%
XOM Exxon Mobil Corp. 67.61 6.37% 16.99 3.98 1.68 2.48% 42%
MON Monsanto Company 70.83 6.40% 25.48 2.78 1.06 1.50% 38%
DNB Dun & Bradstreet Corp. 74.38 7.64% 12.40 6.00 1.40 1.88% 23%
FPL FPL Group, Inc. 48.84 7.84% 12.30 3.97 2.00 4.10% 50%
BRO Brown & Brown, Inc. 17.73 8.64% 16.42 1.08 0.31 1.75% 29%
UMBF UMB Financial Corp. 40.41 11.20% 18.37 2.20 0.74 1.83% 34%
T AT&T Inc. 26.11 12.59% 12.32 2.12 1.68 6.43% 79%
WEYS Weyco Group, Inc. 23.55 13.11% 21.22 1.11 0.60 2.55% 54%
FFIN First Financial Bankshares, Inc 51.93 13.16% 20.13 2.58 1.36 2.62% 53%
AWR American States Water 35.20 14.21% 21.73 1.62 1.04 2.95% 64%
CWT California Water Service 38.32 14.42% 19.65 1.95 1.19 3.11% 61%
WTR Aqua America, Inc. 17.63 14.55% 22.90 0.77 0.58 3.29% 75%
THFF First Financial Corp. 29.12 14.96% 16.83 1.73 0.90 3.09% 52%
SHEN Shenandoah Telecom 18.59 15.47% 29.05 0.64 0.32 1.72% 50%
SFNC Simmons First National Corp. 27.60 15.48% 15.86 1.74 0.76 2.75% 44%
SYBT S.Y. Bancorp, Inc. 22.88 15.56% 19.23 1.19 0.68 2.97% 57%
LLY Eli Lilly and Company 36.15 16.95% 9.18 3.94 1.96 5.42% 50%
MLM Martin Marietta Materials, Inc. 86.50 17.24% 45.29 1.91 1.60 1.85% 84%
LKFN Lakeland Financial Corp. 19.18 17.31% 15.22 1.26 0.62 3.23% 49%
PGN Progress Energy Inc. 39.74 18.63% 14.66 2.71 2.48 6.24% 92%
NWN Northwest Natural Gas 46.98 18.70% 16.60 2.83 1.66 3.53% 59%
OTTR Otter Tail Corp. 22.18 19.06% 31.24 0.71 1.19 5.37% 168%
PBI Pitney Bowes Inc. 24.45 19.97% 11.99 2.04 1.46 5.97% 72%
MGEE MGE Energy Inc. 35.45 20.50% 16.04 2.21 1.47 4.15% 67%
UGI UGI Corp. 26.72 20.85% 12.09 2.21 0.80 2.99% 36%
26 Companies


Watch List Summary 

The best performing stock from last week's list, is California Water Service (CWT) which rose 4.1%. The worst performing stock is Tompkins Financial Corp. (TMP) which fell 3.3%. Overall, the Dividend Achiever watch list gained 1.2% versus the Dow gained of 0.7%.

New addition to this list is Dun & Bradstreet (DNB) which is a former Dividend Achiever. DNB was removed from this list in 2000 after stopping the dividend payment. They reinstated dividend in March 2007 at $0.25 per share and have been raising that over the past three years. Current payout is at $0.35 which equate to annual increase of 12%.
- Art

Email our team here.

Coppock Curve Q & A

A reader asks:
"Isn't it possible to determine good times to sell stocks using the Coppock Curve?"
Touc's reply:
My understanding of the Coppock Curve is that it is strictly for the purpose of giving buy signals. Sell signals are purely coincidental if they occur at all.
Drawing from Mr. Coppock's own words in Barron's October 15, 1962 article, Mr. Coppock states that,"It [Coppock Curve] gives a so-called buy signal."(page 5) Mr. Coppock goes even further to state that, "Because well-timed buying is far more difficult for the nonprofessional investor than timely selling, it is best to think of the curve as a very long-term buying guide. Its formula was devised for that type of use." (page 5,16)

In James Dines' book Technical Analysis (page 377, 1972), there is no mention of the Coppock Curve as being able to provide a sell signal or eminent market slumps. Any mention of the Coppock Curve was with the ability of the Curve to "pinpoint the start of new trends and enable investors to select future market leaders." (page 378)
There seems to be no evidence that would suggest that the Coppock Curve should be used to determine potential declines. Instead, the Curve should only be tested on its ability to accurately call the bottom in a given stock or index.
Best regards.
Email our team here.