Author Archives: NLObserver Team

Sell Northern Trust (NTRS) at the Market

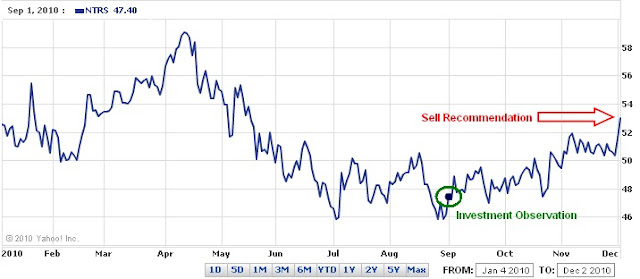
It is now time to recommend that Northern Trust (NTRS) be sold at the market. The stock has performed moderately since the Investment Observation was issued on September 1, 2010. It is highly recommended that anyone who bought the stock based on our insight should re-read the posting. For the most part, Northern Trust retained the recommended market price and moved higher from there.
In the pursuit of "seeking fair profits" the returns that this stock has provided within the last 94 days say that it is necessary to consider alternative opportunities. The key to investment success and a key principle of economics is to seek the best alternatives.
Northern Trust (NTRS) was recommended when it closed at $47.26 on September 1st. Based on this morning’s price of $52.18, NTRS has gained 10.96% (including reinvested dividends.) By catching the stock eight days before the ex-dividend date, we were able to boost the total return from 10.41% to 10.96% a difference of 5.28%.
The annualized return on this position would be close to 43%. Selling this stock now generates a return of 4.62x greater than the amount of the dividend yield if held for a full year. Additionally, the 10.96% gain exceeds the return on a 30-year treasury purchased on September 1, 2010 by 3x.
Those not interested in following through with our sell recommendation can feel comfortable knowing that Northern Trust is a great long-term holding with a 10.96% downside cushion since our investment observation. As the price of NTRS rises, it should be noted that the stock faces significant upside resistance at $56 and $59.
As we have indicated in the purposes and function of this site, our goal is to:
  • Maximize the annual yield of each trade.
  • Reduce the time between buying and selling of each stock.
  • Exceed the annual yield of government guaranteed alternatives in each trade.
Investment observations are intended to be a starting point for investigating a quality company at a reasonable price. It is hoped that after doing the background research you can buy the stock at a lower price. Ideally the stock should be held in a tax-deferred account and should not consist of less than 20% of your holdings. Personally, we prefer holding only 2-3 stocks at a time.
For a portfolio of $10,000 with a 20% position that gains 10.96%, the impact on the entire portfolio is 2.19%. This is contrasted with the same portfolio with a 5% position that gains 10.96%, the impact on the entire portfolio is 0.548%. By choosing generally conservative dividend increasing stocks at or near a new low, the odds of success are increased in your favor making the assumed increase in risk worthwhile.
Sell recommendations are intended to deal with the short-term reality of the market. The tracking of the Sell recommendations are the worst case scenario if you happen to have bought a stock at the time the Investment Observation was made (please avoid making this mistake.) We aim for modest returns, therefore we are happy with 9-12% annualized gains.
It is always recommended that when selling a stock, one should not place stop orders, limit orders or orders after hours as detailed in our article "Automatic Orders Don't Provide Protection." This leaves the seller in the position of being vulnerable to the whims of the market makers. Instead, place your sell orders only as a market order during market hours. Some would complain that a market order during market hours might leave some profits on the table. However, we would rather leave some money on the table rather than have it taken away from us by the trades that are placed by institutions and market makers.
Please revisit New Low Observer for edits and revisions to this post. Email us.

Investment Observation: ConAgra (CAG) at $21.48

Today’s Investment Observation is on ConAgra (CAG). According to Yahoo!Finance, “ConAgra Foods, Inc. operates as a food company in North America and internationally. It operates in two segments, Consumer Foods and Commercial Foods. The Consumer Foods segment provides branded, private label, and customized food products, which are sold in various retail and foodservice channels. The Commercial Foods segment provides commercially branded foods and ingredients principally to foodservice, food manufacturing, and industrial customers.”

After a cut in 2006, ConAgra (CAG) has had a steady, albeit irregular, increase of the dividend. Prior to 2006, ConAgra had a 28-year history of consecutive dividend increases according to Mergent’s Handbookof Dividend Achievers. As recently as September 21, 2010, ConAgra announced a 15% increase of the dividend from the previous year.

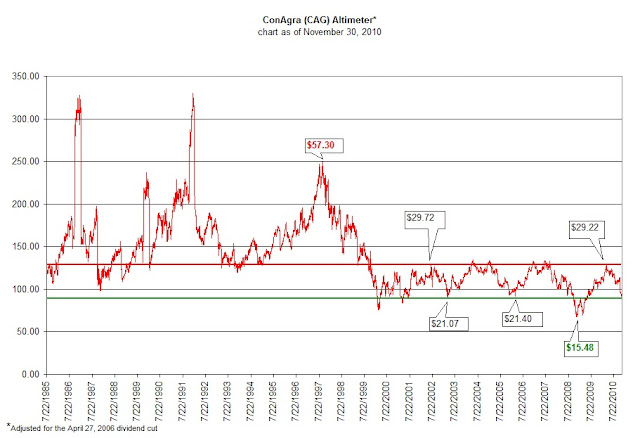
In our analysis of ConAgra (CAG), we’ll first address the technical pattern of Edson Gould’s Altimeter. The altimeter suggests to us that ConAgra is reasonably undervalued in relation to the dividend. The green horizontal line in the chart below is the indicated level where ConAgra would normally be considered undervalued at $21.40 per share. On the opposite end at the overvalued range, ConAgra would trade at approximately $29.72 as indicated by the red horizontal line. The extremes of the under and over valuation are indicated in green and red text, respectively. We adjusted the altimeter to reflect the cut in dividend of 2006. This means that the percentage decrease of the dividend was applied to periods before 2006 to obtain a representative perspective on the altimeter.
According to Value Line Investment Survey dated October 29, 2010, ConAgra (CAG) is expected be around the $40 range by 2014. We opted to err on the side of caution on this matter and have taken the view that, from the current price of $21.48, we could reasonably expect that ConAgra could rise to $30 or 39.7% over the next 3-4 years. However, our investment strategy requires that if we get a 10% gain in less than a year in a tax-deferred account then we’ll consider the next best investment alternative if we can identify one at that time.

Value Line also indicated that ConAgra is fairly valued at 12 times cash flow. Using the full year cash flow figure for 2010, ConAgra should return to a fair value of $30. Again, this is far above the current price by 39.7% and in perfect alignment with Gould’s Altimeter; which shows that ConAgra’s range established since 1999 is still intact.

Dow Theory ascribes a fair value for ConAgra of $20.04 based on the peak of March 23, 2010 and the trough on December 4, 2008. The Dow Theory downside targets from the current level are:
  • $20.04
  • $17.96
  • $13.80
The downside risk, in our opinion, is 36% below the current price of $21.48. We believe that anyone considering ConAgra should carefully assess their willingness to accept such downside risk.

In a recent posting (link here), we submitted that for the “buy-and-hold” investor, a company like ConAgra would outperform, in the long run, the performance of gold and silver companies like Newmont Mining (NEM) and Coeur D’Alene (CDE); later changed to Hecla Mining (HL) for its continuous price history through the 1970s. We intentionally used the period of the gold and silver bull market to compare ConAgra to the stocks mentioned. We included the silver stocks because we have frequently written that in the past, as is the case presently, silver outperforms gold.

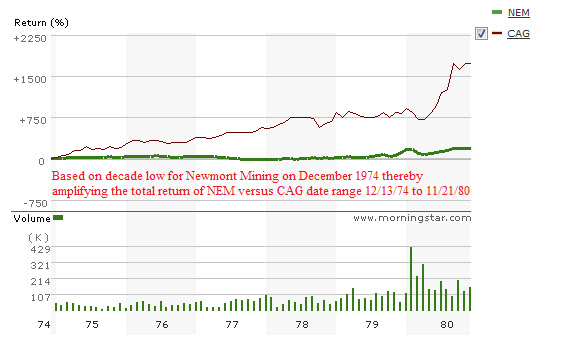
Critics argued that Coeur D’Alene wasn’t exactly the best-run company around. Others said that the timeframe of 1970 to 1983 was biased against precious metal stocks since the peak in gold and silver was in 1980. To answer these critics, we only used Newmont Mining at its lowest price in the period from 1970 to 1980 which occurred on December 13, 1974. We then compared the performance of ConAgra to Newmont until November 21, 1980. The chart below, courtesy of Morningstar.com, is even more astounding than the one initially created. As the chart below demonstrates, instead of outperforming Newmont by 7x, ConAgra beat Newmont by almost 17x.
The last critic standing on our comparison of Newmont Mining, Coeur D’Alene, and ConAgra said that comparing companies from 1970 to 1983 has no relevance to the current environment.  We’re hoping that such a perspective is correct and guessing that any critic making such a remark believes that inflation and interest rates will not be heading higher anytime soon.
 
Please revisit New Low Observer for edits and revisions to this post. Email us.

December 2010 Ex-Dividend Dates

Below are the approximate ex-dividend dates for the month of December for companies that appear on our Dividend Achiever, Nasdaq 100, Dow Jones Transportation Index and International Dividend Achiever Watch Lists. All companies are ranked by ex-dividend dates.
Companies that show up on our Watch Lists could be considered the equivalent of the bargain bin of high quality blue chip stocks. Because these companies have increased their dividends every year for at least 10 years in a row or are part of the Nasdaq 100 and within 20% of their respective 52-week low, you know that you’re not overpaying for a company that has demonstrated profitability and the ability to rebound from challenging times.
Symbol Name Price EPS Div/Shr Yield Pct from Yr Low Ex-Div
CHFC Chemical Financial Corp $20.93 0.71 0.8 3.80% 11.39% 12/01/10
IMO Imperial Oil Limited $36.03 2.23 0.43 1.20% 2.42% 12/01/10
PEP Pepsico, Inc. $63.92 3.97 1.92 3.00% 8.80% 12/01/10
ANAT American National Insurance $79.71 5.37 3.08 3.90% 7.51% 12/01/10
CBSH Commerce Bancshares, Inc. $37.48 2.5 0.94 2.50% 6.78% 12/06/10
CHL China Mobile Limited $49.69 4.34 1.64 3.30% 11.89% 12/06/10
FNF Fidelity National Financial $13.63 1.34 0.72 5.30% 8.17% 12/07/10
UMBF UMB Financial Corp $37.44 2.37 0.78 2.10% 17.85% 12/08/10
NTRS Northern Trust Corp $50.20 2.92 1.12 2.20% 10.81% 12/08/10
WMT Wal-Mart Stores, Inc. $53.67 4.03 1.21 2.30% 12.35% 12/08/10
KMB Kimberly-Clark Corp $61.53 4.42 2.64 4.30% 5.63% 12/08/10
VFC V.F. Corp $83.00 5.27 2.52 3.00% 19.87% 12/08/10
BDX Becton, Dickinson and Co $77.12 5.49 1.64 2.10% 16.02% 12/08/10
STFC State Auto Financial Corp $15.83 0.03 0.6 3.70% 18.13% 12/09/10
SYBT S.Y. Bancorp, Inc. $23.69 1.44 0.72 3.00% 19.65% 12/09/10
IRET Investors Real Estate Trust $8.94 0.02 0.69 7.60% 12.17% 12/12/10
SFNC Simmons First National Corp $28.75 1.63 0.76 2.60% 18.90% 12/12/10
SUBK Suffolk Bancorp $25.78 1.68 0.88 3.40% 10.22% 12/12/10
BXS BancorpSouth, Inc. $12.86 0.06 0.88 6.90% 4.81% 12/13/10
VLY Valley National Bancorp $12.71 0.76 0.72 5.60% 3.61% 12/13/10
PPDI Pharmaceutical Product Dev. $24.92 0.8 0.6 2.40% 19.46% 12/13/10
LEG Leggett & Platt $20.55 1.17 1.08 5.30% 14.87% 12/13/10
UHT Universal Health Realty Income $35.05 1.38 2.42 6.80% 18.73% 12/13/10
HI Hillenbrand Inc $19.50 1.54 0.75 3.90% 9.55% 12/13/10
OMI Owens & Minor, Inc. $28.42 1.92 0.71 2.40% 11.36% 12/13/10
MRK Merck & Company $34.69 2.59 1.52 4.40% 13.00% 12/13/10
FFIN First Financial Bankshares, Inc $48.79 2.72 1.36 2.80% 12.03% 12/13/10
RNR RenaissanceRe Holdings $60.48 13.42 1 1.60% 19.86% 12/13/10
TSS Total System Services $15.14 1.05 0.28 1.80% 12.90% 12/14/10
MCY Mercury General Corp $43.20 3.83 2.4 5.50% 19.17% 12/14/10
RLI RLI Corporation $58.14 5.52 1.16 2.00% 17.86% 12/14/10
GE General Electric $15.97 0.92 0.48 3.00% 16.15% 12/15/10
FRS Frisch's Restaurants $21.70 1.89 0.6 2.70% 19.96% 12/15/10
ECL Ecolab Inc. $48.56 2.16 0.62 1.30% 19.43% 12/16/10
CINF Cincinnati Financial Corp. $29.77 3.04 1.6 5.30% 18.56% 12/20/10
SRE Sempra Energy $49.62 2.99 1.56 3.10% 13.00% 12/26/10
OFC Corporate Office Properties $33.91 0.33 1.65 4.80% 3.75% 12/27/10
NUE Nucor Corp. $37.39 0.64 1.44 3.80% 4.70% 12/27/10
USB U.S. Bancorp $24.00 1.54 0.2 0.80% 17.42% 12/27/10
XRAY DENTSPLY International Inc. $30.73 1.85 0.2 0.60% 10.70% 12/27/10
WPC W.P. Carey & Co. $29.50 1.95 2.03 6.90% 19.48% 12/27/10
SYK Stryker Corp $50.19 3.22 0.6 1.20% 17.43% 12/27/10
IBKC IBERIABANK Corp. $50.83 5.99 1.36 2.70% 5.22% 12/27/10
CWCO Consolidated Water Co. Ltd. $8.91 0.3 0.3 3.30% 10.00% 12/28/10
LRY Liberty Property Trust $31.67 0.4 1.9 6.00% 16.52% 12/28/10
HCC HCC Insurance Holdings, Inc. Co $28.31 2.89 0.58 2.10% 18.70% 12/28/10
FULT Fulton Financial Corp. $8.76 0.54 0.12 1.40% 7.75% 12/29/10
TR Tootsie Roll Industries $26.87 0.92 0.32 1.20% 15.82% 12/29/10
BANF BancFirst Corp. $40.11 2.69 1 2.50% 15.03% 12/29/10
CAH Cardinal Health $35.52 2.71 0.78 2.20% 19.64% 12/29/10
ITW Illinois Tool Works $47.40 3.25 1.36 2.90% 17.53% 12/29/10
If you happen to be researching these companies for potential investment, it would be advisable to consider the ex-dividend date prior to possible purchases. Owning the shares of the company that you're interested in before the ex-dividend date entitles you to the upcoming dividend payment.
Owning the shares on or after the ex-dividend date means that you would have to wait at least three months before receipt of the next dividend payment. Please verify the ex-dividend date and payout ratio before committing funds to these stocks. Additionally, do not base your next long or short-term purchase on the dividend payment or yield. Instead, get as much research in as you possibly can before the ex-dividend date "just in case" you're actually interested in buying the stock. Payout ratios that exceed 100% should be considered speculative investments.
Please revisit New Low Observer for edits and revisions to this post. Email us.

Nasdaq 100 Watch List

Below are the top Nasdaq 100 companies that are within 20% of the 52-week low. This list is strictly for the purpose of researching whether or not the companies have viable business models. These companies are deemed highly speculative unless otherwise noted.

Symbol Name Price P/E EPS Yield P/B % from Low
APOL Apollo Group, Inc. $34.46 9.53 3.62 0 3.75 0.76%
CSCO Cisco Systems, Inc. $19.46 14.27 1.36 0 2.4 1.46%
ISRG Intuitive Surgical, Inc. $257.08 30.6 8.4 0 4.92 4.48%
AMGN Amgen Inc. $53.83 11.64 4.63 0 2.12 7.10%
TEVA Teva Pharma.  $50.37 15.5 3.25 1.40% 2.07 7.19%
DISH DISH Network $19.01 9.34 2.04 0 N/A 9.76%
ADBE Adobe Systems $28.40 31.7 0.9 0 2.84 11.59%
MSFT Microsoft Corp $25.37 10.91 2.33 2.50% 4.58 11.61%
SHLD Sears Holdings $66.22 27.13 2.44 0 0.84 11.84%
GRMN Garmin Ltd. $29.40 8.03 3.66 5.30% 1.93 12.60%
XRAY DENTSPLY Intl $31.40 16.99 1.85 0.60% 2.43 13.11%
FLIR FLIR Systems, Inc. $27.62 18.6 1.49 0 2.93 15.08%
PAYX Paychex, Inc. $28.81 21.48 1.34 4.40% 7.1 16.88%
ATVI Activision Inc $11.74 40.76 0.29 1.30% 1.3 18.23%
HSIC Henry Schein, Inc. $58.21 16.86 3.45 0 2.2 18.55%
GILD Gilead Sciences, Inc. $37.78 11.05 3.42 0 5.28 19.07%
CTAS Cintas Corp $27.53 18.87 1.46 1.80% 1.61 19.18%

Watch List Summary
In the Nasdaq 100 watch list of 17 companies from November 10, 2010 to the closing price of November 24,2010, the average return from all of the companies listed was –0.05%. This is compared to the NDX (Nasdaq 100 Index) which had a decline of –1.55%. Urban Outfitter (URBN) carried our watch list by rising 15.42% while office supplies company Staples (SPLS) was not far behind with a gain of 9.05%.
The laggards from the November 10, 2010 watch list were Intuitive Surgical (ISRG) with a –7.51% decline followed closely behind by Apollo Group (APOL) which fell –6.46% in APOL’s long quest to find a bottom.
Although we often take an interest in stocks with a declining trend, Apollo Group (APOL), with a declining trend over 2 years long, has not found it’s way on our Speculative Observation list. On the other hand, the steady decline of Intuitive Surgical (ISRG) does warrant additional consideration. Intuitive Surgical (ISRG) has a Dow Theory fair value from the March 2009 low to April 2010 high at $154 with the support level of $256.12 recently broken, the only remaining support levels before the fair value level is $221.90 and $187.68.
Top Five Performance Review
In our ongoing review of the Nasdaq 100 Watch List, we have taken the top five stocks on our list from November 27, 2009 and have check their performance one year later. The top five companies on that list are provided below with the closing price for November 27, 2009 and November 24, 2010.
Name 2009 2010 1yr % change
Cephalon, Inc. 55.23 65.47 18.54%
Ryanair Holdings 25.83 30.99 19.98%
Gilead Sciences 45.56 37.78 -17.08%
Genzyme Corp 51.07 71.81 40.61%
Apollo Group, Inc. 55.76 34.46 -38.20%
Average 4.77%
Nasdaq 100 1765.46 2153.91 22.00%
Nasdaq Composite 2138.44 2534.56 18.52%

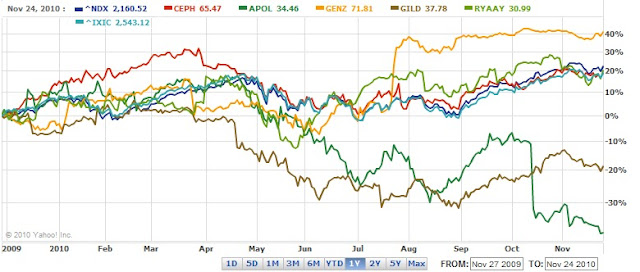
As a group, the top five companies on our Nasdaq 100 list averaged a gain of 4.77% in the last year. This compares with the Nasdaq 100 Index gain of 22% and the Nasdaq Composite gain of 18.52% in the same one-year time frame. Surprisingly, only one stock, Gilead Sciences (GILD), did not achieve 10% gains within the first four months.
Of the two companies that took large losses, Apollo Group (APOL) fell –38.20% while Gilead Sciences (GILD) fell –17.08%. It is worth noting that Apollo Group (APOL) will probably be dropped from the Nasdaq 100 index on December 10th thereby adding more downside pressure to the stock.
Disclaimer
On our current list, we excluded companies that have no earnings. Stocks that appear on our watch lists are not recommendations to buy. Instead, they are the starting point for doing your research and determining the best company to buy. Ideally, a stock that is purchased from this list is done after a considerable decline in the price and extensive due diligence. We suggest that readers use the March 2009 low (or the companies' most distressed level in the last 2 years) as the downside projection for investing. Our view is to embrace the worse case scenario prior to investing. A minimum of 50% decline or the November 2008 to March 2009 low, whichever is lower, would fit that description. It is important to place these companies on your own watch list so that when the opportunity arises, you can purchase them with a greater margin of safety. It is our expectation that, at the most, only 1/3 of the companies that are part of our list will outperform the market over a one-year period.
Please revisit New Low Observer for edits and revisions to this post. Email us.

Watch List Double Take

After highlighting the performance of Sysco (SYY) during the commodity bull market from 1970 to 1983 on our recent NLO Dividend Watch List, we decided to see how another food distributor/producer stacked up against precious metal stocks.
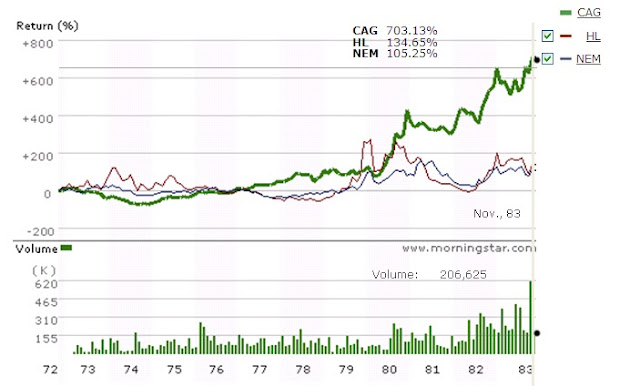
The total return chart of ConAgra (CAG) below (courtesy of Morningstar.com) should be all you need to know about alternative investment opportunities to gold and silver stocks.  Like Sysco (SYY), ConAgra (CAG) has had incredible performance against precious metal stocks during a period when there is a lot of hype about the benefits of investing in stocks like Newmont (NEM) and Hecla Mining (HL).  If you believe that record high inflation is coming down the road and you're a long-term investor and don't mind a 4.28% dividend yield, research in ConAgra (CAG) just might be for you.
Source: Morningstar.com, date range: 11/20/1972 to 11/19/1983


Below is a chart of CAG compared only to Newmont Mining (NEM) at the very lowest price of NEM on December 13, 1974 to the high of NEM at or near the peak of gold stocks.  In this case, NEM has the bold green line while CAG has the thin red line.  Note that CAG has a total return almost 17 times that of NEM.


Please revisit New Low Observer for edits and revisions to this post. Email us.

NLO Dividend Watch List

Watch List Summary

This week's list contains 21 companies that are among some of the biggest blue-chip institutions out there. Topping this list is the giant food supplier, ConAgra (CAG). A quick glance at the one year performance review of the top five companies (see below) and you may want to consider ConAgra (CAG) as a potential investment.

In addition, there are great household names such as Kimberly-Clark (KMB), Colgate-Palmolive (CL), Pepsi (PEP), and Clorox (CLX) that we are all familiar with. Inflation themed investors can look to another major food supplier to restaurants, Sysco (SYY).  In the following article we wrote on December 17, 2008, we compared Sysco to Newmont Mining (NEM) and Couer D'Alene (CDE) from 1970 to 1983.  On a total return basis, according to Morningstar.com, Sysco gave far superior returns (4 times greater) than the leading gold and silver stocks did during a commodity boom.

The New Low team is very interested in re-purchasing Bank of Hawaii (BOH) as the banking sector is seen as out of favor. If interested, investors can refer to our original writing on Bank of Hawaii from initiation to sell recommendation with a detailed follow-up titled "The Anatomy of a Bear Market Trade."

November 19, 2010 Watch List

Symbol Name Price % Yr Low P/E EPS (ttm) Div/Shr Yield Payout Ratio
CAG ConAgra Foods, Inc. 21.48 2.19% 13.68 1.57 0.92 4.28% 59%
WABC Westamerica BanCorp.  50.50 2.98% 15.83 3.19 1.44 2.85% 45%
IBKC IBERIABANK Corp.  50.52 4.57% 8.43 5.99 1.36 2.69% 23%
GBCI Glacier BanCorp., Inc.  13.32 5.05% 21.14 0.63 0.52 3.90% 83%
VLY Valley National BanCorp.  13.01 6.14% 17.12 0.76 0.72 5.53% 95%
KMB Kimberly-Clark Corp. 61.84 6.16% 13.99 4.42 2.64 4.27% 60%
ABT Abbott Laboratories 47.40 6.30% 15.64 3.03 1.76 3.71% 58%
CLX Clorox Co. 62.93 6.73% 13.50 4.66 2.20 3.50% 47%
CBSH Commerce Bancshares, Inc.  37.59 7.09% 14.98 2.51 0.94 2.50% 37%
CL Colgate-Palmolive Co. 78.21 6.96% 18.27 4.28 2.12 2.71% 50%
LLY Eli Lilly & Co. 34.50 7.75% 7.91 4.36 1.96 5.68% 45%
BOH Bank of Hawaii Corp. 44.95 8.05% 11.83 3.80 1.80 4.00% 47%
CWT California Water Service 36.44 7.78% 19.28 1.89 1.19 3.27% 63%
WFSL Washington Federal, Inc.  15.17 8.59% 14.45 1.05 0.20 1.32% 19%
SYY Sysco Corp. 28.84 8.83% 14.87 1.94 1.04 3.61% 54%
FULT Fulton Financial Corp.  8.87 9.51% 16.43 0.54 0.12 1.35% 22%
FNFG First Niagara Financial Group 12.31 9.62% 19.54 0.63 0.60 4.87% 95%
TFX Teleflex Inc. 52.62 9.81% 12.99 4.05 1.36 2.58% 34%
PEP Pepsi Co Inc. 64.71 10.14% 16.30 3.97 1.92 2.97% 48%
EGN Energen Corp. 44.41 10.34% 11.87 3.74 0.52 1.17% 14%
PNR Pentair, Inc. 32.53 10.61% 17.87 1.82 0.76 2.34% 42%
21 Companies


Top Five Performance Review

In our ongoing review of the NLO Dividend Watch List, we have taken the top five stocks on our list from November 20, 2009 and have check their performance one year later. The top five companies on that list were Aqua America (WTR), First Financial (THFF), California Water(CWT), WGL Holding (WGL), and UGI (UGI).

Name Symbol 2009 Price 2010 Price % change
AQUA AMERICA INC WTR 15.88 21.05 32.56%
First Financial Corporation Ind THFF 27.96 31.1 11.23%
CALIFORNIA WATER SVC CWT 35.78 36.44 1.84%
WGL HOLDINGS INC WGL 31.33 37.12 18.48%
U G I CP UGI 23.36 30.16 29.11%


Average 18.64%


Dow Jones Industrial DJI 10,318.16 11,203.55 8.58%
S&P 500 SPX 1,091.38 1,199.73 9.93%

As a group, the top five companies on our Dividend List averaged a gain of 18.64% in the last year. This compares with the Dow Jones Industrial Average gain of 8.58% and the S&P500 gain of 9.93% in the same one year time frame. Again, the graph below demonstrates that all stocks achieved 10% gains within six months of being on the watch list from November of 2009.

Disclaimer

On our current list, we excluded companies that have no earnings and payout ratios in excess of 100%. Stocks that appear on our watch lists are not recommendations to buy. Instead, they are the starting point for doing your research and determining the best company to buy. Ideally, a stock that is purchased from this list is done after a considerable decline in the price and extensive due diligence. Because our list has many great companies, we urged investors to filter for companies with less than 50% payout ratio. This should minimized the risk of dividend reductions if earnings are to fall by half. If you understand the companies' history and their ability to pay the dividend, then payout ratios in excess of 50% may be considered. We suggest readers use the March 2009 low (or companies' most distressed level in the last 2 years) as the downside projection for investing. Our view is to embrace the worse case scenario prior to investing. The November 2008 to March 2009 time frame fits that description. It is important to place these companies on your own watch list so that when the opportunity arises, you can purchase them with a greater margin of safety.

Please revisit New Low Observer for edits and revisions to this post. Email us.

Answering the Critics

We've gone to exceptional lengths to answer the critics of our most recent article titled "A Comparison Between Dividend Strategies."  Please visit the comment section (located here) for thought provoking questions on our methodology and conclusions.  We certainly learned a lot in the process and hope you do as well.

Please revisit New Low Observer for edits and revisions to this post. Email us.

A Comparison Between Dividend Strategies

In an effort to contrast our work with our peers, we recommend that readers review the article titled “11 High Yield Stocks to Buy Now” published October 10, 2010 on Seeking Alpha. This list of companies is compiled by Scott’s Investments blog and was intended to provide top choices for income investors with an interest in trading dividend stocks. Although we have always indicated that our list of stocks is useful for both long and short-term investors, we couldn’t help but attempt to contrast our October 8, 2010 NLO Dividend Watch List [NLO] with the performance of Scott’s Investments [SI].
Because both articles were generated and posted onto the internet after the market closed on Friday October 8, 2010 and before the market open on Monday October 11, 2010, we thought it would be possible to make a few observations about the performance of the stocks on each list.
In order to make our observations we have attempted to ensure data integrity by making a few assumptions. First of all, we decided to make our list from October 8th only the top eleven companies to match the number of companies on the SI list. Next, to determine the performance of each stock, we used the October 8th to November 15th closing prices as our benchmark. Finally, we calculated the adjusted closing price for all of the stocks that paid a dividend between October 8, 2010 and November 15, 2010.

Our first observation on the performance between the NLO Dividend Watch List [NLO] and Scott’s Investments [SI] is that the NLO list accomplished a gain of 6.25% compared to SI’s gain of 2.17%. There is little to explain why there is such a disparity in the two lists. Especially since the [SI] list is tailor-made for individuals interested in dividend income at a time when investors of all stripes are more aware of the need for an income component to their portfolio. This is contrasted with the NLO list which only has the requirement that the stocks have, or have had, a history of dividend increases of more than 10 years in a row and within 20% of the 52-week low. From our perspective, we normally chose the stocks nearest the new low and then work our way up from a qualitative standpoint based on fundamental and technical attributes.

Scott's Investments 11 High Yield Stocks to Buy Now October 10,2010
Ticker Company 10/8/10* 11/15/10* Change** Yield on 10/8
Q Qwest Inc. 6.34 6.85 8.04% 5.05%
MO Altria Group Inc. 24.51 24.69 0.73% 5.79%
FTR Frontier Communications 8.39 9.1 8.46% 11.20%
PGN Progress Energy Inc. 44.57 44.38 -0.43% 5.56%
POM Pepco Holdings, Inc. 19.11 18.85 -1.36% 5.65%
WIN Windstream Corporation 12.14 13.05 7.50% 8.24%
CTL CenturyLink, Inc. 39.76 42.33 6.46% 7.24%
SO Southern Company 37.26 38.33 2.87% 4.83%
TEG Integrys Energy Group, Inc. 53.07 51.48 -3.00% 5.13%
CNP CenterPoint Energy, Inc. 15.9 16.22 2.01% 4.91%
HCP HCP, Inc. 35.83 33.18 -7.40% 5.19%
    Avg Return: 2.17%    
Source:  Scott's Investments October 10, 2010
  11 High Yield Stocks to Buy Now

Our next observation is that, although the NLO list rose at a much more torrid pace than the SI list, the best and worst performers for the NLO list outpaced the SI comparables. Of the best performing stocks, the NLO’s Beckman Coulter (BEC) rose 16.26% while the SI best performer, Frontier Communications (FTR), rose 8.46%. The Beckman Coulter (BEC) rise outpaced Frontier Communications (FTR) by 92%. This suggests that the positions taken in the NLO list are likely to be higher risk.

NLO Dividend Watch List October 8, 2010
Ticker Company 10/8/2010* 11/15/2010* Change** 10/08 Yield
CL Colgate-Palmolive Co. 74.39 78.37 5.35% 2.73%
CAG ConAgra Foods, Inc. 21.65 21.61 -0.18% 3.83%
NTRS Northern Trust Corp.  48.35 51.30 6.10% 2.32%
WST West Pharmaceutical 34.94 38.33 9.70% 1.95%
BBT BB&T Corp. 23.43 25.05 6.91% 2.56%
MDT Medtronic 33.45 34.66 3.62% 2.57%
BEC Beckman Coulter 47.78 55.55 16.26% 1.53%
SBSI Southside Bancshares 18.98 19.92 4.95% 4.37%
USB U.S. BanCorp. 22.31 24.94 11.79% 0.90%
WFSL Washington Federal 15.27 15.24 -0.20% 1.31%
FUL HB Fuller Company 20.24 21.15 4.50% 1.38%
Average Return: 6.25%
Source: New Low Observer October 8, 2010
NLO Dividend Watch List
http://www.newlowobserver.com/2010/10/dividend-watch-list.html
When comparing the worst performing stocks from each list, we get a picture that may suggest that the overall risk, at least in the short run, in the NLO list might be worthwhile. Of the worst performing stocks, the NLO’s ConAgra (CAG) fell by -0.20% while the SI worst performer, HCP Inc. (HCP), fell by -7.40%. The loss incurred in HCP Inc. was 37 times the loss of CAG. However, we cannot be certain, based on the results, whether or not the high performance of the NLO list is clear evidence of the high-risk nature of the stocks or that the NLO selection process is calibrated for better performance. We would rather err on the side of caution and assume that the NLO list is biased towards higher risk.
Though not significant, another potential factor that contributed to the gains for the NLO list was the fact that more dividend payments were made within the last month than were the case for the SI list. However, this dispels the claim that because a dividend payment is made the stock price is adjusted lower. To the shareholder of a dividend paying stock, the cost basis is adjusted lower, not the stock price prior to, at the time of or after a dividend payment.
The author of the “11 High Yield Stocks to Buy Now” does indicate that the stocks were ideally suited for the purpose of trading. However, the full benefit of such stocks is likely to be recognized over a period of at least a year. After all, if the high yield is never recognized due to trading then it seems as though better alternatives that don’t pay a dividend may be overlooked in the process.

Since we suspect that the SI portfolio will perform quite well over an extended period of time. We will review these same portfolios after a year to determine if there are any new lessons to be learned from selecting stocks based on high dividend yields.

Notes:
*based on closing price of October 8, 2010 and November 15, 2010
**all prices for Oct 8th and Nov 15th are adjusted for dividends

Please revisit New Low Observer for edits and revisions to this post. Email us.

The End of Wilmington Trust (WL)

In its heyday, Wilmington Trust (WL) garnered considerable respect in the wealth management industry.  In fact, Wilmington Trust had increased its dividend for 27 years in a row until April 2009. Wilmington, a wealth management firm with a growing banking presence, became mired in troubled real estate construction loans that went bad as the financial markets unwound in 2007. After a TARP injection of $330 million and a capital raise of $274 million, Wilmington found itself in need of a savior.
In an October 16, 2010 article in Barron’s titled “A Bank on the Brink” by Erin Arvedlund, the future prospects of Wilmington Trust (WL) are covered in great detail. At the time of the article, Wilmington Trust was trading at $7.79. Barron’s asked Dick Bove banking analyst for Rochdale Research and Andy Stapp of B. Riley and Co. their view on the prospects for Wilmington Trust.
Dick Bove indicated that Wilmington Trust (WL) management “would rather shoot themselves than sell” to another institution, adding that “they may have no choice.” Bove said that Northern Trust (NTRS), a company profiled as an Investment Observation on our site, was among the potential acquirers of Wilmington. In the final analysis, Bove said that whoever ends up buying Wilmington Trust would have to “have faith” that the financials were accurate and that “it’s a crap shoot” for anyone to consider Wilmington.
Andy Stapp, senior analyst at B. Riley and Co. seemed to have a more optimistic view on Wilmington Trust (WL) saying that only a minority interest was likely to be sold at around $9 to $11 per share. Despite his belief that Wilmington Trust could possibly sell at a premium of 13%-39% above the market price, Stapp did hold off issuing a buy recommendation of the stock until the November 1st earnings release.
On October 25, 2010, in an article titled “Wilmington Trust Stock Slides,” TheStreet.com discussed the prospects of Wilmington Trust (WL). According to Janney Montgomery Scott analyst Stephen Moss, Wilmington Trust could be acquired for $8 per share but would not be surprised if the company sold for “substantially less.”
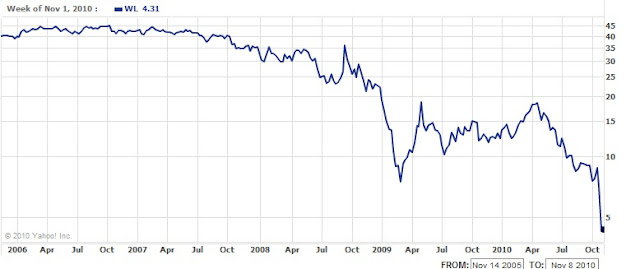
On November 1, 2010, it was announced the M&T Bank (MTB) would acquire Wilmington Trust for $3.84 per share, a discount of 46% below the closing price of October 29, 2010. According to a ThomsonReuters news article titled “M&T Bank Snaps Up Bargain-priced Wilmington” the shares of Wilmington Trust were being bought based on the tangible book value of the company at the end of September 2010. Almost overnight, the price of Wilmington Trust (WL) was cut in half.
Final Observations:
  • Bove was right, WL was a crap shoot at $7.79
  • Stapp was wrong, WL was not nearly worth $9
  • Tangible book value is a good starting point for research
  • Always be prepared for the market price of a stock to be cut in half

Please revisit New Low Observer for edits and revisions to this post. Email us.

Nasdaq 100 Watch List


Watch List Summary

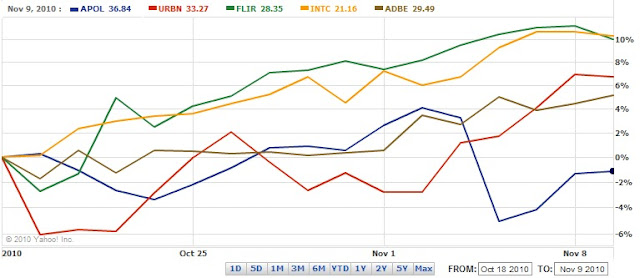
The companies on our Nasdaq 100 Watch List from October 18, 2010 have averaged a 6.36% gain in the intervening period.  In the same period, Oct. 18 to Nov. 9th (based on the closing price), the Nasdaq 100 has gained 3.46%.  FLIR Systems (FLIR) gained 9.93% while Intel (INTC) gained 9.52%.  When including the dividend paid by Intel, the stock increased in value by 11.13%  The laggard of the group was Apollo Group (APOL) with a decline of -1.15%.  The chart below shows all of the Nasdaq 100 stocks from October 18th.

Nasdaq 100 Watch List

Symbol Name Price P/E EPS Yield P/B % from Low
WCRX Warner Chilcott plc $20.89 10.28 2.03 N/A 2.66 5.67%
APOL Apollo Group, Inc. $36.84 10.19 3.62 N/A 4.01 5.80%
TEVA Teva Pharmaceutical In $50.81 15.64 3.25 1.40% 2.11 8.13%
ISRG Intuitive Surgical, Inc. $277.96 33.08 8.4 N/A 5.44 8.96%
AMGN Amgen Inc. $54.93 11.87 4.63 N/A 2.17 9.29%
PAYX Paychex, Inc. $27.77 20.71 1.34 4.40% 6.99 12.66%
XRAY DENTSPLY . $31.64 17.12 1.85 0.60% 2.49 13.98%
URBN Urban Outfitters, Inc. $33.27 21.65 1.54 N/A 4.07 14.61%
GRMN Garmin Ltd. $30.01 8.2 3.66 4.90% 2.04 14.94%
DISH DISH Network Corporation $19.91 11.94 1.67 N/A N/A 14.95%
ADBE Adobe Systems Incorporated $29.49 32.91 0.9 N/A 2.98 15.87%
PDCO Patterson Companies Inc. $28.22 15.25 1.85 1.40% 2.35 16.95%
SPLS Staples, Inc. $20.45 18.11 1.13 1.70% 2.32 17.19%
HSIC Henry Schein, Inc. $57.72 16.72 3.45 N/A 2.25 17.56%
FLIR FLIR Systems, Inc. $28.35 18.91 1.5 N/A 3.11 18.13%
ATVI Activision Blizzard, Inc $11.77 40.59 0.29 1.30% 1.33 18.53%
MSFT Microsoft Corporation $26.95 11.59 2.33 2.40% 4.92 18.57%
CTAS Cintas Corporation $27.62 18.93 1.46 1.70% 1.66 19.57%

Top Five Performance Review

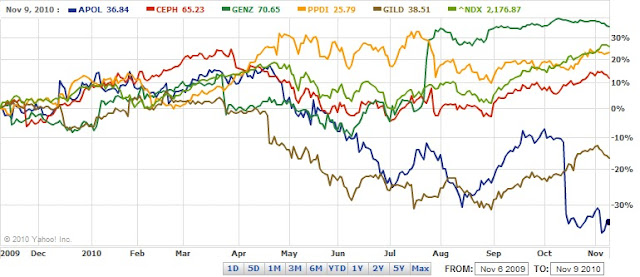
In our ongoing review of the Nasdaq 100 Watch List, we have taken the top five stocks on our list from November 6, 2009 and have check their performance one year later. The top five companies on that list are listed below with the closing price for November 6, 2009 and November 9, 2010.
Name Symbol 2009 Price 2010 Price % change
Apollo Group APOL 55.99 36.84 -34.20%
Cephalon CEPH 58.26 65.23 11.96%
Genzyme Corp GENZ 52.28 70.65 35.14%
Phama. Prod. Develop. PPDI 19.26 25.79 33.90%
Gilead GILD 46.26 38.51 -16.75%
Average 6.01%
Nasdaq 100 1730.76 2176.88 25.78%
Nasdaq Composite 2112.44 2562.98 21.33%

As a group, the top five companies on our Nasdaq 100 list averaged a gain of 6.01% in the last year. This compares with the Nasdaq 100 Index gain of 25.78% and the Nasdaq Composite gain of 21.33% in the same one year time frame.  Of the two companies that took large loses, Gilead Sciences (GILD) appears the most appealing from a research standpoint. Apollo Group (APOL) appears unable to right itself due to signifcant governmental and industry pressures.
Disclaimer

On our current list, we excluded companies that have no earnings. Stocks that appear on our watch lists are not recommendations to buy. Instead, they are the starting point for doing your research and determining the best company to buy. Ideally, a stock that is purchased from this list is done after a considerable decline in the price and extensive due diligence. We suggest readers use the March 2009 low (or companies' most distressed level in the last 2 years) as the downside projection for investing. Our view is to embrace the worse case scenario prior to investing. The November 2008 to March 2009 time frame fits that description. It is important to place these companies on your own watch list so that when the opportunity arises, you can purchase them with a greater margin of safety.  It is our expectation that, at the most, only 1/3 of the companies that are part of our list will outperform the market over a one year period.

Please revisit New Low Observer for edits and revisions to this post. Email us.

* Warner Chilcott (WCRX) will be removed from our watch list due to the price decline associated with a special dividend (WSJ article link) paid in September 2010. A chart with the adjusted price after the special dividend is located here.

Dow Theory Q&A

A reader comments on a prior thought:

1. Part of the confusion might be that Mr. Schannep gave a SELL signal on 30 Jun 10 -- that articlle of yours seems to have been published that very day, while the 2nd sentence implies that it was written the previous day. Therefore, the next signal would have to be BUY, which came 27 Sep 10.

Is it possible you missed the 30 Jun 10 signal?

Also, your 7 Nov 10 article implies a "bull market indication" on 24 Jun 09 -- I'm not sure what that means, but as a historical note, Schannep gave a BUY signal on 9 Apr 09.


2. Regarding Dow Theory analysis: At its simplest, my understanding is that a market move must meet rather basic criteria for time and distance, as noted on page 18 (examples follow) of the book, with caveats.

A secondary reaction move, after a primary market high or low must be about 3% -- enough to allow ONE index to recover at least 3%; ONE index -- but not both -- may exceed the previous high or low. It must take at least two weeks to reach that point, which sets a "mark" (peak or trough). After which, when BOTH indicies exceeds their "mark", there is a Dow Theory Signal -- a change in trend, turn of the tide, etc.

So, the market picture for 2010 was:

DJI: High on 26 Apr, reaction mark on 7 Jun, bounce on 18 Jun, SELL signal on 30 Jun.

DJT: High on 3 May, reaction mark on 7 Jun, bounce on 15 Jun, SELL signal 30 Jun.

I've omitted SPX, since you folks seem to be somewhat "purist". However, I might suggest a review of the Dow Theory section of "Technical Analysis of Stock Trends (9th Edition)", page 24 in particular. As the basis for Dow's Theory is market movement, it should be reflected in -- or at least agree with -- movement in such a large index. In addition, merely because it did not exist when Dow, Nelson, Hamilton or Rhea were alive does not merit exclusion from consideration. Deliberately ignoring it, as Russell and Moroney do, may be akin to using Ptolemy to critique Copernicus.

The previous caveats mentioned are threefold:

1. Schannep rigorously defines Bull and Bear markets as a 19% rise/16% drop from low/high (those are reciprocal) on page 86. Therefore, they serve as a "trailing stop", should Dow Theory not give a signal.

2. Schannep also defines "capitulation" on page 90 (10% drop below 10 week average) as a drop significant enough to warrant shortening the two-week timeframe to one week, for a BUY signal.

3. The bounce after a reaction must occur over more than one day; thus the 27 May 10 bounce was not valid.

Hope that is helpful.

Our Response:

It is definitely possible that we could have missed the June 30 sell signal.  However, Let us try to prove that our understanding of Dow Theory is correct.

First, there is the issue of the primary trend. No primary trend stops and then re-starts only two months apart. This goes back to the issue that you’ve mentioned about the timing of a call. Such a short period of time between bull or bear market calls is a tip-off that a false signal had to have been triggered on June 30, 2010. A review of the primary trend from Rhea, Hamilton, Nelson, Russell and Schaefer is in order on that point.


Second, Dow Theory is all about confirmations. No matter which source that is used, there was not a confirmation of the decline to the same supports levels in the Transportation and Industrial Averages for the Feb. 5th and Feb. 7th. This is very significant because the exact same confirmation of both the Industrials and Transports was used to re-issue a buy indication on November 3 by Mr. Schannep. Although it should be said that Mr. Schannep used the S&P and the Industrials which gave a “buy” only a couple days ahead of the standard Transports and Industrials signal. Was it worth the extra days advance notice? Absolutely, if you’re already out of the market. However, Hamilton, Rhea and Russell are very clear on the risk of jumping the gun on bull and bear market signals without accurate confirmation.

In our November 4th “analysis” we were specific in indicating that we chose to opt for the sure fire call instead of the earlier call on September 27th when the markets broke above the line. Again, if the call for a “buy” signal can wait 4.73% for the sure-fire confirmation of the bull market or “buy” signal then we’ll opt for the most conservative route.

The whole premise of Dow Theory is about following the steps as outlined by Nelson and further elaborated on by Hamilton and Rhea. When E. George Schaefer proposed the 50% principal, he didn’t create something that wasn’t already a part of Dow Theory. Schaefer only highlighted an aspect that others may have taken for granted or overlooked. Adding elements that didn’t exist may seem to bring the concept of Dow Theory out of the dark ages. However, there are specific aspects that Schannep has introduced that are not consistent with Dow Theory.

Third, the introduction of the S&P 500 as a valid index to track is erroneous in that it assumes that there is an advantage by introducing the index. Since the S&P 500 was created in 1957, all data prior to 1957 is modeled on a 100% correlation to the Dow Jones Industrial Average. This means that movement in the index would have mirrored the Dow industrials which is impossible now and therefore could not possibly happen before 1957. This means that all insightful examination of price movements of the S&P 500 before 1957 is useless.

There is evidence to suggest that in the period from 1929-1932, data from the Barron’s 50 index actually declined by only 78% instead of the Dow Industrials’ 89% reflecting that human judgment related to changed in the index impacted the outcome of the decline. Without the S&P 500 being in existence at the time there is no way to test this theory. We covered the topic of changes Dow Industrial Average and their impact from 1929 to 1932 in our article titled “Dow Jones’ Decline Largely Impacted by Index Changes” and “After the Crash of 1929, Recovery was Quick.”

In addition, the current beta on the movement between the Dow Industrials and S&P 500 is only occasionally at 1 or 99.9% correlated. In any instance that there isn’t a correlation it is in the favor of the Industrials. This defies logic since any index of stocks with only 30 companies should fall by a greater magnitude and rise by a greater magnitude than an index of 500 companies. If you use the Yahoo!Finance interactive charting, you will find that during almost any period since 1970, the Dow Industrials fell less than, and rose more than, the S&P 500. Although this isn’t true for every period it is true for the majority (80/20) of periods selected especially if you pick periods further out in time to the present. This means that signals gained by one index will not be the same with another index.

We’ve already shown that there is a problem with the belief that a broader index provides more accuracy and stability in the markets in our article titled “Diversification Doesn’t Matter.” In fact, we’ve done a recent update on this data and have found that the Dow Industrials have exceed the performance of the S&P 500 in the 5-year, 3-year, 1-year, and YTD categories. In addition, the 2008 performance of the Dow Industrials fell less than the S&P 500 which defies the point of having a diversified index.

The net result of sticking to an index that existed over an extended period of time is that people of today can test the validity of the claims made by Dow Theorists in the past. If we cannot test the theory on a continuous index then we would not be able to prove or disprove the accuracy of the claims. Being able to prove the claims of people in far flung eras allow for us to give credence to the facts.

Our next issue is the introduction of Edwards and McGee’s classic book Technical Analysis of Stock Trends (9th edition). The use of such a source is unfortunate since it is not the source. The source for Dow Theory is from books published by Russell, Schaefer, Greiner, Shumate, Fritz, Dow, Nelson, Hamilton, Rhea, Olmerod, Collins and Raeder. All of the aforementioned are Dow Theorists first. Although a great book, Technical Analysis of Stock Trends is not an authoritative source for considered understanding on Dow Theory even though they correctly say that "...Dow Theory is the granddaddy of all technical market studies."

Schannep’s definitions of a bull and bear market and the parameters that are set around such definitions are probably useful and profitable. However, it is probable that we’re talking about Schannep’s theory instead of Dow’s theory. I don’t mind that Schannep has his own way of accounting for bull and bear markets. However, Dow Theory is usually much more simplified than what has been proposed by Schannep.

As mentioned before, your understanding of Schannep’s work is far greater than ours. This gives you the benefit of knowing, in our opinion, one more approach on the topic than we have. We couldn’t claim to be Dow purists since we’ve only opted for the method that seems the simplest. 


We hope our response has added food for thought and thank you for your contribution to Schannep’s work. As a subscriber to Schannep’s service, you are a credit to his efforts and thank you for your time spent explaining his philosophy.

Please revisit New Low Observer for edits and revisions to this post. Email us.

Market Price and Market Share, And Never The Twain Shall Meet

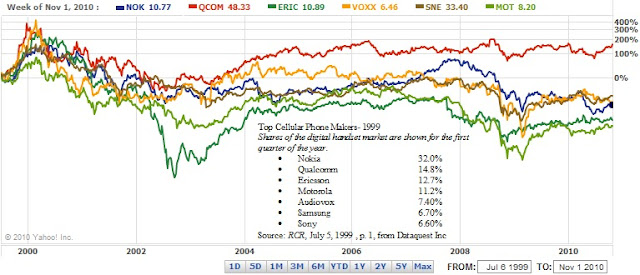
Many companies strive to obtain dominance in market share.  Market share is thought to be the critical element that will propel a company's stock price higher and dominance in an industry.  Unfortunately, that usually isn't the case.  As time moves on, a new company takes a commanding role in a market that they were never thought to be a part of.  Companies that are market leaders today are likely to become failed behemoths in a few years from now.  This is especially true in the technology industry where each new invention is meant to replace all prior technologies by combining all aspects of the old technologies into the new iteration (all things to all people).
In the example below, we show the chart and table of the leaders of the top cellular phone makers in 1999.  While we understand that the industry was in its infancy, it is interesting to see the performance of the respective companies in comparison to their leadership roles in the industry.  In the nearly 11 years since being on the list, none of the original companies have managed to increase their share price beyond their year 2000 highs. Only one company, Qualcomm (QCOM), has managed to increase its share price above the 1999 level.
Below we show the current mobile phone leaders with Nokia (NOK) still in the number one position while Samsung has gone from number 6th ranked in 1999 to number 2 ranked behind Nokia in 2010.


Top Five Mobile Phone Vendors, Shipments, and Market Share, Q3 2010
Vendor 3Q10 Unit Shipments 3Q10 Market Share 3Q10/3Q09 Change
1. Nokia
110.4
32.40%
1.80%
2. Samsung
71.4
21.00%
18.60%
3. LG Electronics
28.4
8.30%
-10.10%
4. Apple
14.1
4.10%
90.50%
5. R.I.M.
12.4
3.60%
45.90%
Others
103.8
30.50%
28.30%
Total
340.5
100.00%
14.60%
Source: IDC Worldwide Quarterly Mobile Phone Tracker, October 28, 2010
New entrants like LG, Apple (AAPL) and RIM (RIMM) are now vying for whatever portion of market share that they can. However, the focus on market share may not be so good in either the short and long run for their stock prices as represented in the chart above. With this in mind, those investment analysts who make the case that increased market share is justification for why a stock price should be increased or at a premium should review the same claims of similar companies in periods past.
  • Updated mobile data for 1999, 2010, and 2016 available here.

Please revisit New Low Observer for edits and revisions to this post. Email us.

A Lesson in Dow Theory

In a September 20, 2010 article titled “Dow Theorist Believes Buy Signal is Imminent” on MarketWatch.com, there are views from three different well known Dow Theorists with different conclusions from each one of them. This is an instance where the author, Mark Hulbert, should at least know something about the topic on which he writes. Instead, the author clouds the picture on Dow Theory, which few people really understand or write about. Since Mark Hulbert rates the performance of stock market newsletter, he should probably stick to the performance numbers rather than muddy the interpretation on Dow Theory by writers who aren’t following the clearly defined rules of the theory.

Now it is the job of the New Low Observer team to clean up the confusion created by Mr. Mark Hulbert, on the inaccuracies of the Dow Theorists.

First, in all instances, none of the theorists mentioned (Russell, Schannep, Moroney) could possibly be interpreting Dow Theory accurately if they are somehow about to generate a “buy” signal. This would mean that prior to a buy signal there would have been a sell signal indicated. According to our work on Dow Theory, which is well documented and freely available (check here), there hasn’t been a single sell signal since the July 24, 2009 bull market indication which was selected by the New Low Observer team as the initiation date of our website. This is further evidenced by the simple fact that the Industrials and Transports have continued to climb higher since March 2009 to the present.

Not to be outdone is the great Dow Theorist Richard Russell. Mr. Russell is referred to in the article as a “traditionalist” when it comes to Dow Theory. Mr. Russell says that he cannot “…say that even a short term buy signal has been generated. That’s because the Dow Transports as of mid-day trading in New York remain about 1% below their early August high (which came in at 4,516.35).” To his credit, Mr. Russell sticks with the use of the Dow Transportation Average for an indication of a Dow Theory “buy” signal.

Unfortunately, on the very first day that the Transports exceeded the 4,516.35 level on September 28, 2010, Russell never gave any indication that a short-term buy was at hand. The very next day, still no indication of a short-term buy indication. September 30th, still no indication of a “short-term” buy signal. As the Transportation Average continued to climb to the current level of 4,923.40, Mr. Russell has made no reference to Dow Theory based on the numbers or the technicals. Instead, Mr. Russell has talked about the major premise behind Dow Theory is values. While this is true, some consideration of current market action is what Dow Theory is all about. The pattern created by the “short-term” buy signal is exactly the same one that Russell used when he called the market bottom in January of 1975. We’re not certain why he doesn’t recognize this pattern today.

Next, as a Dow Theorist of sorts (we’re not really sure), Mr. Schannep has several issues that require addressing. Among our concerns, Mr. Schannep never needed to replace the Dow Jones Transportation Average for the S&P 500 Index in order to get a Dow Theory signal. We understand the goal of Mr. Schannep in this strategy, reduce the period of time to garner a signal so that more upside is obtain. If, in fact, the goal of Mr. Schannep was to get an earlier signal by using the S&P 500, then he probably got it by three days at best.

It is important to note that if Mr. Schannep was applying anything like Dow’s theory, then he would have to wait for the last of the two indicators to confirm a signal. This means that although the S&P 500 signal came almost two weeks ahead of the Transportation index, the Industrials’ confirmation came within three days of the Transports’ confirmation. The chart below demonstrates how Mr. Schannep could have utilized the Transportation index and gotten the same signal in the same period of time.

The matter of timing the signal is a concern that plagues every Dow Theorist. However, resorting to the tactics of Mr. Schannep only undermines the point of Dow Theory as outlined by Robert Rhea in his book The Dow Theory. Instead of changing Dow’s theory into our own, in order to generate earlier signals, we have decided to use Dow’s Theory as an asset allocation tool instead. More funds in stocks that are undervalued during bull market indications and fewer funds in stocks that are undervalued during bear market indications. This way, we’re not beholden to issues of late signals requiring modifications of Dow’s theory.

The article suggested that on September 20, 2010 a buy signal was about to be registered according Jack Schennep’s website. Mr. Schannep manages to mix the usage of the Dow Industrials, Dow Transports and the S&P 500 index to garner a “Dow Theory” buy or sell signal. It appears that, according to Mr. Schannep, if you cannot get clarity from the standard indicators, the Dow Industrials and Dow Transports, then you replace any one of the two indexes with the S&P 500 index. Mr. Schannep indicates that this approach is a more modern strategy for determining Dow Theory buy and sell indications. We don’t like Mr. Schannep’s modification to the Dow Theory but if it works profitably for his subscribers then more power to him. However, it should be said that Mr. Schannep isn’t practicing Dow Theory.

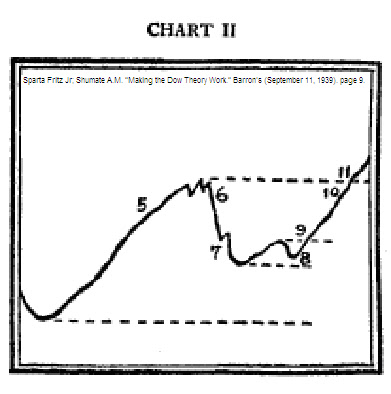
Another problem we have with Mr. Schannep is that he advocates buying at a point just short of a full confirmation. A reasonable market technician would agree that if there is only 4.73% before a clear indication is given (new high), why try to capture so little with the prospect that the market could reverse direction? Instead, wait for the clear signal and decide how much you want invested in the next move. This idea is driven home in the following chart and excerpt from a 1939 series of articles in Barron’s that later became the book “Making the Dow Theory Work” by Sparta Fritz Jr. and A.M. Shumate.


“Point 9 represents the upward penetration of the minor high, with encouragement from the volume of trading. The averages are still at levels to suggest buying.

“All rules of sound practice would forbid buying at point 10. Possible losses, figured against recent lows, are unattractively large. At the same time, a bullish forecast still lacks the authority which the averages could give by bettering the old highs. If the speculator has missed the good chances that have been left behind, surely he out not buy here. It will be far wiser to wait and pay a little more, when and if the averages jump the hurdle of their former highs.

“Aside from other considerations that enter into forecasting, the market position at point 10 actually suggests to the speculator a tactical sell-out of some of his stock. Suppose it turned out that the bull market was over. Important savings could be made by sales here. The speculator can step aside, and re-enter the market at a slight concession, if the highs are bettered.

“The bull market is demonstrated to be still in progress at point 11. Stocks can be bought here, but it cannot be considered a first-class risk. It is simply the last reasonable buying level as the primary trend moves on. Stocks bought here will sometimes show a loss on the next reaction.”

Sparta Fritz Jr; Shumate A.M. “Making the Dow Theory Work.” Barron’s (September 11, 1939). page 9.
Basically, Mr. Schannep recommends buying the market at the equivalent of point 10 when he could have more certainty in the call at point 11. In our view, this isn’t a responsible approach to calling the market, let alone a mangled version of Dow Theory.

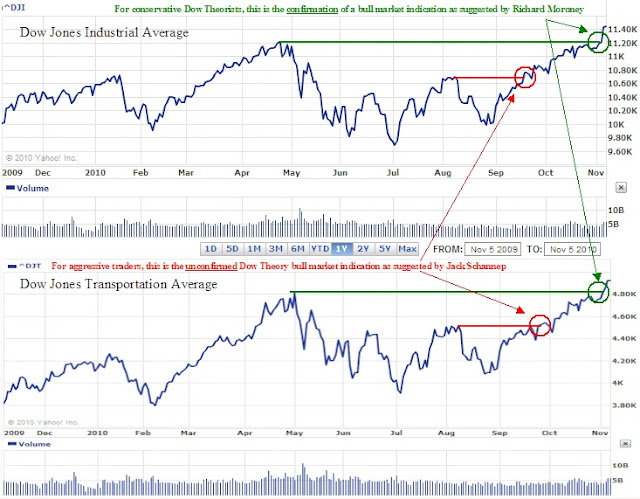
The MarketWatch.com article makes reference to Richard Moroney of the Dow Theory Forecasts newsletter. Mark Hulbert says that Mr. Moroney has an interpretation of Dow Theory that is “different than that of both Schannep and Russell, the two Dow averages must surpass their mid April highs to trigger a buy signal. Those levels, which remain some way off, are 11,205.03 for the Industrials and 4,806.01 for the Transports.” Based on his commentary, Mr. Moroney is the only one who is actually practicing Dow Theory. The numbers that Mr. Moroney indicated as being required for a Dow Theory buy signal were exactly the same numbers that the New Low Observer team was looking for as a continuation of the bull market.

Unfortunately, there is a distinction between a “buy” signal and continuation of the trend. As mentioned before, a buy indication means that a sell had to be given previously. A continuation of the trend indicates that a prior signal is being confirmed and nothing has changed. This nuance is very importance since anyone who considers buying at this point should understand that “…it cannot be considered a first-class risk…” as described by Fritz and Shumate.

The handling of such a topic as Dow Theory should not be left to chance when the material on the topic is so accessible. Unfortunately, Mark Hulbert isn’t aware of the discrepancies mentioned above. Such a lack of knowledge on Mr. Hulbert’s part only feeds the misunderstanding about Dow’s Theory. This is reflected in the comment section that follows the article where readers justifiably deride the theory and it’s practitioners.
Note:
Any and all bull market indications are within the context of a secular bear market.  The secular bear market is deem over when the Dow Industrials and Dow Transports exceed the previous highs set in 2007.  Therefore, the current market is considered to be a "bear market rally" or a cyclical bull market.
Please revisit New Low Observer for edits and revisions to this post. Email us.

NLO Dividend Watch List

Watch List Summary

This week's watch list shrank drastically after an amazing run in the market. According to Dow Theory, this bull market still has legs after the Dow Jones Industrial Average confirmed the move of the Dow Jones Transportation Average at the closing on Wednesday, November 3, 2010. We elaborate further in the article, Dow Theory: Continuation of Bull Market Confirmed. We suggest anyone who missed that article to revisit it.
Although companies on our watch list may not appear to be "exciting," they contain some of the best run companies in the world. For example, we all know Colgate, Clorox, Kimberly-Clark (maker of Kleenex) and Pepsi. This may be a good time to start your research on these companies. Once you have determined the potential stock(s), you may want to refer to our post on the November ex-dividend dates which may help boost the gain or offset the costs.

November 5, 2010 Watch List

Symbol Name Price % Yr Low P/E EPS (ttm) Div/Shr Yield Payout Ratio
CAG ConAgra Foods, Inc. 22.15 4.14% 14.11 1.57 0.92 4.15% 59%
CL Colgate-Palmolive Co. 77.45 4.84% 18.48 4.19 2.12 2.74% 51%
CLX Clorox Co. 62.61 5.09% 14.77 4.24 2.20 3.51% 52%
WABC Westamerica BanCorp.  51.50 5.54% 16.14 3.19 1.44 2.80% 45%
KMB Kimberly-Clark Corp. 63.01 5.80% 14.26 4.42 2.64 4.19% 60%
BOH Bank of Hawaii Corp. 45.37 6.42% 11.94 3.80 1.80 3.97% 47%
CBSH Commerce Bancshares, Inc.  38.75 8.04% 15.44 2.51 0.94 2.43% 37%
PEP PepsiCo Inc. 65.08 9.85% 16.39 3.97 1.92 2.95% 48%
8 Companies


Top Five Performance Review

In our ongoing review of the NLO Dividend Watch List, we have taken the top five stocks on our list from November 6, 2009 and have check their performance one year later. The top five companies on that list were Aqua America (WTR), California Water (CWT), Monsanto (MON), Wal-Mart (WMT), and Piedmont Natural Gas (PNY).

Name Symbol 2009 Price 2010 Price % change
Aqua America WTR 15.63 21.93 40.31%
California Water CWT 35.16 37.72 7.28%
Monsanto MON 67.87 62.27 -8.25%
Wal-Mart WMT 50.12 55.2 10.14%
Piedmont Nat Gas PNY 22.02 29.59 34.38%
Average 16.77%
Dow Jones Industrial DJI 10,023.42 11,444.08 14.17%
S&P 500 SPX 1,069.30 1,225.85 14.64%

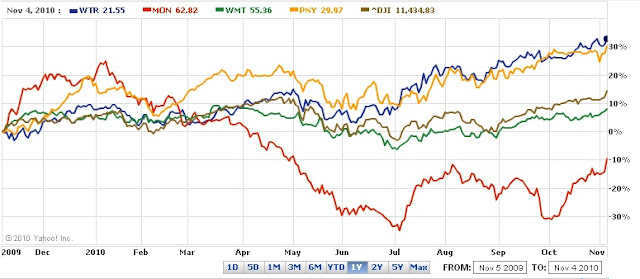
As a group, the top five companies on our Dividend List averaged a gain of 16.77% in the last year. This compares with the Dow Jones Industrial Average gain of 14.17% and the S&P500 gain of 14.64% in the same one year time frame. The top performing stock of the group was Aqua America (WTR) which closes out the year with a gain of 40.31%. The worst performing stock was Monsanto with a loss of 8.25% in the one year time period. The graph below demonstrates that all stocks, except Wal-Mart, achieved 10% gains within six months of being on the watch list from November of last year.

Disclaimer

On our current list, we excluded companies that have no earnings and payout ratios in excess of 100%. Stocks that appear on our watch lists are not recommendations to buy. Instead, they are the starting point for doing your research and determining the best company to buy. Ideally, a stock that is purchased from this list is done after a considerable decline in the price and extensive due diligence. Because our list has many great companies, we urged investors to filter for companies with less than 50% payout ratio. This should minimized the risk of dividend reductions if earnings are to fall by half. If you understand the companies' history and their ability to pay the dividend, then payout ratios in excess of 50% may be considered. We suggest readers use the March 2009 low (or companies' most distressed level in the last 2 years) as the downside projection for investing. Our view is to embrace the worse case scenario prior to investing. The November 2008 to March 2009 time frame fits that description. It is important to place these companies on your own watch list so that when the opportunity arises, you can purchase them with a greater margin of safety.

Please revisit New Low Observer for edits and revisions to this post. Email us.

Yearning for the Richard Russell of Yore

As Dow Theorists, it is required that we read the information that is put out by Richard Russell. So it perturbed us to find that there has been nary a peep on Russell’s site about Dow Theory based on the recent movement of the Dow Jones Industrial Average and the Dow Jones Transportation Average. As noted on our site today, Dow Theory has given a reiteration of the bullish trend that has been in place since the July 2009 bull market confirmation.
In the last two days we have feverently scoured Russell’s website for any confirmation of our perspective on Dow Theory. We’ve found nothing. Even more alarming is the vague reference to Dow Theory as it pertains to value. This reference in passing was circumspect at best and puts into question any attempt to demonstrate any understanding of the topic. On November 3, 2010, Richard Russell said:

My own opinion regarding the markets is that the test of values trumps all other considerations.

Russell goes on to conclude that based on historical values of the market, stocks and bonds are in a bubble. After concluding that stocks and bonds are in a bubble, Russell says that he doesn’t want his subscribers to buy stocks or bonds. Finally, in his November 3, 2010 posting, Russell laments the period of 1997 to 1999 and states, to our disbelief:

Who were those geniuses who piled into AMZN [Amazon.com] when it was selling for under five clams?

Along with the preceding quote, Russell included only a chart of AMZN and a description on how much he buys almost everything from the Amazon.com.
We’re not so sure that Russell was pining for AMZN back in July 1, 1998 when Amazon.com was selling for $19.02 [adjusted for splits]. At that time, in his letter published on the same date, Russell said:

Bookseller Amazon.com is priced at over 81 [ $81 unadjusted/$19.02 adjusted] now, but it won’t be making a nickel of profit for at least two years.

 There was no indication that Amazon.com was at a value at the time.
On November 4, 2010, Russell ties the concept of Dow Theory to values. This was the first reference to Dow Theory after the bull market confirmation on November 3rd. In this excerpt, Russell gives an idea as to what exactly he looks for to determine values, namely dividend yield and P/E ratios. Then Russell goes on to say:
In the business of investing, money is made in the buying (see Amazon study on yesterday’s site). Buy right and you’ll end up with profits. Buy wrong, and you’ll end up with tears.
We were perplexed that Russell would connect Amazon.com with buying values at a time when, back in 1998, there were no dividends to generate a dividend yield and no earnings to generate a P/E ratio. This attempt to demonstrate the importance of values was further distorted when Russell starts discussing buying gold in the November 4th article. Russell said:
Buy gold at the highs, buy gold on a correction, buy gold when its in a confusing consolidation, and within five years you’ll thank the day when you bought it.
To say “Buy gold at the highs…” counters all the efforts to educate investors on the importance of values. In addition, there was no reference to the fact that Dow Theory had giving a bull market confirmation. It is troubling that Russell further tarnishes his reputation as a keen observer of markets [regardless of being right or wrong] by not addressing the validity of the signal on a theory that is the title of the newsletter.
Although we generally agree with Russell’s perspective on gold, for different reasons, we hope his subscribers aren’t being led astray by his blatant contradictions simply because he is bullish on gold at a time that the gold market happens to be moving higher.

Sources:

Please revisit New Low Observer for edits and revisions to this post. Email us.