Today’s Investment Observation is on Wesco Financial (WSC). According to Value Line, Wesco Financial is a diversified company engaged “…in the insurance, furniture rental, and steel service center businesses in the United States.” Charles T. Munger heads Wesco Financial (WSC) and is 80% owned by Berkshire Hathaway (BRK-A). Wesco Financial (WSC) has increased its dividend for 38 years in a row.
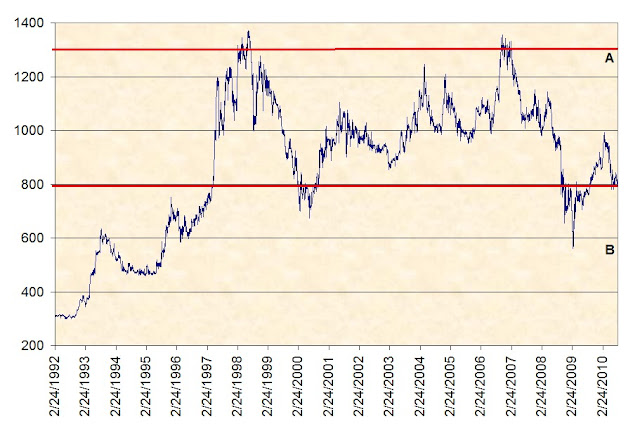
Our initial interest in WSC is drawn directly from Edson Gould’s Altimeter, which puts the dividend payment in relative terms compared to the stock price. This is important since the continuous increase of the dividend is never reflected in the stock charts available. As seen in the chart below, WSC is now selling at a support level that was first established (on a relative basis) on May 12, 1997.

If we use the Altimeter’s peaks and troughs, we arrive at an upside target of $533 (point A). We expect that our upside target is too optimistic and therefore set our sights for the most realistic target of $410. Our downside target, based on the Altimeter, is $246 (point B) or 24% below the closing price of August 23, 2010. However, we would advise investors to build in the expectation that the stock could decline as much as 50% from the current level. The way the New Low Observer team deals with this issue is by buying 50% (of the intended amount to be invested) now and holding the remaining amount for the prospect of the decline.
Our previous experience investing in WSC was back in late 2007 to early 2008 (
2008 transaction history). At the time, WSC had all the redeeming attributes that we see today. However, we sold the stock for a –4% loss just before the price jumped 13%. Although we were quick to pull the trigger on selling WSC with a –4% loss the subsequent 42% decline was worth avoiding.
Dow Theory indicates that WSC is assumed to be at fair value when the stock has reached $363.35 based on the peak from March 18, 2010 to the closing price of July 2, 2010. However, to be as conservative as possible, we would take the high of 2010 and the low of 2009 and determine a worst-case scenario of fair value and arrived at $314.22. This indicates that as long as WSC can hold above the worst-case scenario of fair value, the gains in this stock are almost assured.
There are a few other features that are of particular interest regarding WSC. According to Valueline, there has been absolutely no change in the number of shares outstanding since 2002. In addition, WSC has long-term debt that is negligible and falling since 2002 while the book value has increased by 30.26% over the same period of time. Speaking of book value, based on the dividend increases since May 1997, WSC is selling at the equivalent of $224.55, a discount of 31.25% of the current indicated book value of $352. It should be noted that the current price of WSC is the same as back in 2002.
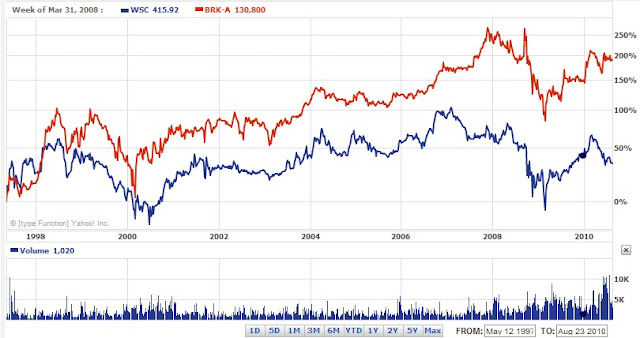
For some strange reason, we’d like to believe that WSC should mirror the performance of BRK-A even though we know this is not true. Both companies are very different not to mention the fact that BRK-A is diversified with a triple A rating. However, we couldn’t resist the temptation to include a comparison chart of WSC (blue line) and BRK-A (red line) since 1997.
In closing, we make our greatest case against WSC with the words of its CEO Charlie Munger:
“Business and human quality in place at Wesco continues to be not nearly as good, all factors considered, as that in place at Berkshire Hathaway. Wesco is not an equally-good but smaller version of Berkshire Hathaway, better because its small size makes growth easier. Instead, each dollar of book value at Wesco continues plainly to provide much less intrinsic value than a similar dollar of book value at Berkshire Hathaway. Moreover, the 7 quality disparity in book value’s intrinsic merits has, in recent years, continued to widen in favor of Berkshire Hathaway. All that said, we make no attempt to appraise relative attractiveness for investment of Wesco versus Berkshire Hathaway stock at present stock-market quotations.”
I’m reluctant to accept that Mr. Munger isn’t just under-promising for the sole purpose of over-performing down the road. At the time that Munger made the above statement WSC was trading at $249.24. Since February 25, 2009, WSC has climbed 30% while BRK-A has climbed 45%. I guess Munger was right. However, I’ll take the 30% increase any day of the week.
There is so much in favor of this company, from a fundamental and technical standpoint, that we recommend doing some cursory research on WSC. Despite the coming global financial collapse caused by hemorrhaging U.S. deficits, Wesco Financial will be around to match the current Dividend Achievers with continuous increases for 55 years in a row.