Author Archives: NLObserver Team

The Jesse James of the Investment Industry?

It has been brought to our attention that the money belonging to the clients and shareholders of Glickenhaus & Co. hasn’t been treated well lately. In fact, the heir apparent to the Glickenhaus business has used client and shareholder money to finance his masters degree in reverse mergers, shell companies and organic “fertilizer.”

Apparently, 29-year old Jesse Glickenhaus wanted to bring the family firm into the modern era by investing in concepts like global warming and China. Unfortunately, the grandson of founder and senior partner SethGlickenhaus, is ahead of his time because the modern era of investing that he wished to introduce to his firm hasn’t arrived.

Jesse bought shares of fertilizer company China Agritech (CAGC) on the seemingly hot tip that Carlyle Group was already up to their armpits in the “stuff.” As well connected as the Carlyle Group is with a network of former heads of state and CEOs, how could you lose?

Being unclear what a shell company is, Jesse decided to dump $4 million dollars into China Agritech (CAGC). Well, as blind luck often works, not even six months after his investment, Jesse Glickenhaus found his shares to be worth approximately half of its initial value. To top it all off, the shares in organic “fertilizer” have been halted on the stock exchange since March 14, 2011.

To the relief of Jesse, having a family money management firm with $1.3 billion of assets under management makes a $2 million dollar loss seem like nothing at all. So it comes as no surprise that Jesse would say, “It would be easy to walk away at this point.” In his usually affable way, Jesse tries to clarify the prior thought with a well rehearsed but poorly chosen remark, “It’s not nothing, but it’s not a big deal for us financially.” The New Low Team isn’t known for quality craftsmanship with words however, we don’t think that such a flippant remark speaks well of the future holdings of Glickenhaus & Co.

With his education complete, Jesse has a new spring in his step and many lessons learned from his experience. What exactly did you learn, Jesse? “In the future, if I find a company in China, I’ll probably stick to those that have had a major, well-known auditor for several years. I learned it’s not that difficult to manipulate the market in a small-cap, publicly traded Chinese company.” Hmmm…that doesn’t sound all that unfamiliar to the methodology applied to China Agritech. Find a well-known company like Carlyle Group that already owned 22% of ChinaAgritech and jump right in.

What really brought down the share of China Agritech? According to Jesse, it was the short sellers. Short sellers are those curmudgeons who hate all that there is to do with free enterprise in the land of opportunity. We’re not sure who the opportunity is for in China, but we’re starting to get the picture. Jesse didn’t say anything about his breadth of knowledge on the topic of shell company listings in the U.S. Neither did he mention being the least bit perturbed that his “investment” has somehow become a sunk cost.

Things got so far out of hand that Jesse’s dad, James Glickenhaus, had to go to China to prove to himself that his son’s investment acumen hasn’t faltered in any way. Sure enough, James was able to confirm that his son is still very special, thank you for asking. James told the short selling neighbors next door to mind their own business and that his son is the best kid on the block by posting on YouTube a defense of his one time visit to the factories in China.

Dad, ever faithful to his son, went on to say that “[China Agritech] management has acted incompetently, there’s no question about it.” Somehow, dad was able to overlook the fact that if the executives of CAGC are inept then the conclusion should be that the investment decision wasn’t so hot either.

We’re not sure how dad’s visit will change the fact that China Agritech (CAGC) cannot be bought or sold since March 11th. Even those cantankerous short sellers can’t exploit poor ol’ CAGC. Stupid rule enforcement, prompted by the shorts, of the SEC and NASDAQ cut off the inevitable rise in the price of the stock.

In the glib fashion that Glickenhaus & Co. is famous for, dad says, “like sending him [Jesse] to business school.” Not to be outdone, Jesse closes with these parting thoughts, “I went into this with an open mind, I didn’t expect to enjoy it as much as I have.”

If the shareholders and clients of Glickenhaus & Co. aren’t somewhat alarmed at the on-record comments made by father and son, Jesse & James, then there should be little surprise at the potential underperformance of the invested funds going forward.

Please revisit New Low Observer for edits and revisions to this post. Email us.

Our Primary Concern: Retaining Profits

We have frequently claimed that our goal was never to have trading strategy while dealing with dividend paying stocks.  In fact, the whole purpose of mining the field of dividend stocks is to increase the odds that we can compound our investment income.
However, a recent example reminds us of the importance of being cognizant that “good” stock selecting isn’t enough.  Adherence to Charles H. Dow’s concept of recognizing values and seeking fair profits is critical to long-term success in the stock market.
In the article titled “When Timing Meets Opportunity,” we’ve outlined the importance of timing when selecting stocks.  That article demonstrated that a focus on stocks near a new one-year low was about as good as any time for starting investment research.  Stocks at a new low represent the best marker for determining values.  Keep in mind that our focus is on stocks that increase their dividend every year or members of the Nasdaq 100.  Thereafter, an individual would need to run through whichever fundamental and technical analysis necessary to make a decision that seems appropriate.  Our philosophy is to consider our portfolio allocation based on what Dow Theory indicates.  If we’re in a bull market we have a higher concentration in a single stock.  If we’re in a bear market then we have lower concentration in a single stock. In general, this addresses the “value” component according to Charles H. Dow.
The aspect regarding seeking fair profits, another Charles Dow tenet, was outlined in our article titled “Seeking Fair Profits in Investment Portfolios.”  That article specifically references quotes by Charles Dow regarding when to take a profit on a stock.  Strangely, Dow recommended taking “fair profits” of 5%.  The New Low Observer Team is a little more adventurous since we seek 10% or more.  However, the point remains that as investors we need to put our expectations in perspective before we commit our money.  Not after we’re stuck with large gains or losses.
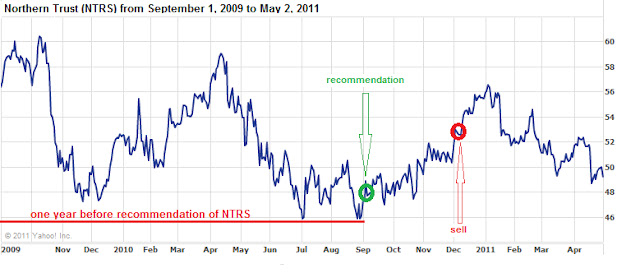
A recent example that we have come across is the case of Northern Trust (NTRS).  Northern Trust (NTRS) typifies what usually happens to a well-timed play on values when the appreciation for “fair profits” isn’t understood.  Northern Trust was recommended on September 1, 2010.  This was almost literally at the one year low from the period of September 1, 2009 to September 1, 2010.
After receiving “only” 10.96% in a period of 64 days, we issued a Sell recommendation on Northern Trust (NTRS) feeling that an annualized gain of nearly 40% wasn’t worth quibbling about.  In the sell recommendation, we indicated that we expected the upside target to be first $56 and thereafter $59.  Almost as impossible as it seems, Northern Trust peaked at $56.86 and turned down from there.  Nearly 7 months on, Northern Trust (NTRS) has ranged from a 19% gains to the current 4%. In addition, this represents a loss of nearly half of the gain that was generated at the time of our sell recommendation.
The situation with Northern Trust typifies our experience and observation when investing in dividend increasing stocks.  Great companies with considerable qualitative elements rise for a moment and revert back to their prior low for inexplicable reasons.  In regards to the general ebb and flow of individual stocks, we’re primarily concerned with accepting what is reasonable and fair rather than what we typically want which is usually for the stock to got back to the previous one-year high.
As rudimentary as it seems, we feel that an understanding of values and seeking fair profits, as espoused by Charles Dow, is essential to long-term success in the stock market.
Please revisit New Low Observer for edits and revisions to this post. Email us.

Teva Pharmaceuticals (TEVA) Now Slated to Acquire Cephalon (CEPH)

The plot thickens with news that Teva Pharmaceuticals (TEVA) is going to buy Cephalon (CEPH) for $81.50 (article here).  Teva’s offer exceeds Valeant Pharmaceuticals’ (VRX) previous bid of $73. 

We originally recommended Cephalon (CEPH) in August of 2009.  After our August 2009 recommendation of Cephalon, we recommended selling the stock near the high of $71 in March 2010 before the decline to $56.  In February 2011 we recommended readers consider Cephalon at the $58 level.  From there the stock has appreciated 39% in less than 3 months.  The most recent run of Cephalon was followed by a sell recommendation on March 30, 2011 at slightly above $75.  We wagered that despite the prospect of getting a sweetened offer closer to the true value of the company, we didn’t need to argue with a nearly 200% annualized return.

Our recent recommendation of Teva Pharmaceuticals (TEVA) on April 5, 2011 puts a twist on our selling of Cephalon.  It has been reported that Cephalon’s board rejected the Valeant offer and has already accepted the Teva offer. 

Interestingly, both Teva Pharmaceuticals and Valeant Pharmaceuticals got a boost in their share price at the announcement of the acquisition of Cephalon.  Typically, the acquiring company shares would decline at the announcement of a major purchase.  This seems to indicates that the market recognizes the positive impact that Cephalon will have on the ultimate acquirer.

Investors seeking the qualitative elements of Cephalon but cannot justify the purchase at the current price can hedge their bets by buying Teva at the current undervalued levels and gain the growth prospects clout of both companies. Obviously, this assumes that the deal goes through between TEVA and CEPH. If the deal with Teva and Cephalon doesn’t go through, we still believe that Teva represents a solid value at the current price. 


Please revisit New Low Observer for edits and revisions to this post. Email us.

Nasdaq 100 Watch List: April 29, 2011

Below are the Nasdaq 100 companies that are within 19% of the 52-week low. This list is strictly for the purpose of researching whether or not the companies have viable business models. Although these companies are very risky, they provide significant opportunity to outperform the market in the coming year.

Symbol Name Price P/E EPS Yield P/B % from Low
AKAM Akamai Tech. 34.43 38.09 0.9 - 2.99 1.41%
TEVA Teva Pharma. 45.73 12.48 3.66 1.90% 1.89 1.94%
CSCO Cisco Systems 17.52 13.25 1.32 1.40% 2.1 6.05%
URBN Urban Outfitters 31.47 19.67 1.6 - 3.71 8.41%
MRVL Marvell Tech. 15.43 11.51 1.34 - 1.89 11.21%
AMGN Amgen Inc. 56.85 11.82 4.81 - 2.13 13.11%
ATVI Activision Blizzard 11.38 34.48 0.33 1.40% 1.34 13.91%
MSFT Microsoft 25.92 11.06 2.34 2.50% 4.63 14.03%
RIMM RIMM 48.65 7.67 6.34 - 3.3 14.39%
APOL Apollo Grp 40.03 15.07 2.66 - 4.34 18.61%

Watch List Summary

The deck has been reshuffled since our last Nasdaq list from April 15th.  New to our list are RIMM (RIMM) and Activision (ATVI).  There are five companies that are no long on our watch list.  Those five companies are Intel (INTC), Staples (SPLS), Infosys (INFY), Celgene (CELG) and Qiagen (QGEN).  Are these the next over-performing stocks for the coming year?  We're not sure but, technically speaking, the downside targets for these stocks are as follows:
  • QGEN-$17
  • INTC-$12
  • SPLS-$18
  • CELG-$48
  • INFY-$62

If you can handle the downside risk, then these might be opportune purchases.

Watch List Performance Review

The companies on our Watch List from a year ago did not hammer out any kind of investment performance to speak of.  Only two of the six companies did well, Qualcomm (QCOM) which rose 48.86% and Genzyme (GENZ) which got bought by SanofiAventis (SNY) for $74 a share.  As a group, the average gain was only 6.81% while the Nasdaq 100 Index rose 15.67% in the same one year period.

Symbol Name 4/24/2010 4/24/2011
% change
GILD Gilead Sciences 41.67 39.06
-6.26%
QCOM QUALCOMM 38.25 56.94
48.86%
GENZ Genzyme Corp 53.93 74.00
37.21%
ATVI Activision Blizzard 11.60 11.32
-2.41%
RYAAY Ryanair Holdings 29.19 29.43
0.82%
APOL Apollo Group 63.53 39.80
-37.35%
- - - Average
6.81%
^NDX Nasdaq 100 Index 2055.33 2377.3
15.67%

Please revisit New Low Observer for edits and revisions to this post. Email us.

Hudson City Bancorp (HCBK) Cut Dividend 46%

Hudson City Bancorp (HCBK) reported their 1Q11 earning results that were a little above the street view back on April 20th. This was exactly one week ago but we didn't see the earning report until today. While HCBK appeared on our 4/22 watch list, this is a great reminder to our readers that these lists are just a starting point.
Although the company reported a net loss of $1.13 per share and reduced their dividend to $0.08 from $0.15, a 46% reduction, shares are actually up roughly 1% (from 9.46 to 9.60).

Please revisit New Low Observer for edits and revisions to this post. Email us.

Dollar Down, Gold Up?

We're not the best observers of the dollar/gold relationship.  However, We have noticed some discussion of the idea that if the dollar declines then the price of gold will (continue to) rise.  This logic seem to make perfect sense, on the surface.  However, we couldn't help but notice that when viewed over a long period of time the idea of gold going up while the dollar is going down doesn't add up.
In the chart below, we see point A as the peak in the price of gold (red line) and point B as the trough.  Correspondingly, we have the trade weighted dollar (blue line) with point C being the peak and point D as the trough.  Because the period of time that lapsed was nearly ten years when the "price" of both the dollar and gold declined at the same time, it seems challenging to cling to the belief that if one falls the other rises in value.
1973-2001
Interestingly, in the period before point A, both indexes rose for a short while.  During points A-C and D-B there was an inverse relationship.  Additionally, the period from 2001 to the present has maintained an inverse relationship with the price of gold going up while the dollar has fallen.

Overall, the number of years that there is a correlation between the dollar and gold is almost the same as the inverse relationship.  Because of the inconsistency of the relationship between gold and the dollar, the "obvious" conclusion doesn't seem to fit.

Please revisit New Low Observer for edits and revisions to this post. Email us.

NLO Dividend Watch List

The market recovered this week and gained 1.3%. The Dow broke above its previous high of 12,426 but the Transports are about 88 points (1.6%) away from the high. Next week UPS (UPS) earnings could guide us with the direction of the transports.

Our watch list this week contains 23 companies that are within 11% of their 52-week low.

April 22, 2011 Watch List

Symbol Name Price % Yr Low P/E EPS (ttm) Dividend Yield Payout Ratio
WABC Westamerica BanCorp.  48.73 1.25% 15.18 3.21 1.44 2.96% 45%
HCBK Hudson City Bancorp, Inc. 9.46 1.94% 8.68 1.09 0.60 6.34% 55%
MCY Mercury General Corp. 38.47 3.16% 13.84 2.78 2.40 6.24% 86%
SJW SJW Corp. 22.96 3.19% 17.66 1.30 0.69 3.01% 53%
TGT Target Corp. 49.9 3.46% 12.48 4.00 1.00 2.00% 25%
HGIC Harleysville Group Inc.  31.82 4.98% 13.15 2.42 1.44 4.53% 60%
SFNC Simmons First National Corp.  25.66 6.12% 11.93 2.15 0.76 2.96% 35%
SYY Sysco Corp. 29 6.89% 14.95 1.94 1.04 3.59% 54%
BMI Badger Meter, Inc. 36.33 6.92% 20.53 1.77 0.56 1.54% 32%
CHFC Chemical Financial Corp.  20.11 7.05% 22.85 0.88 0.80 3.98% 91%
WEYS Weyco Group, Inc.  24.02 7.76% 20.18 1.19 0.64 2.66% 54%
NWN Northwest Natural Gas Co. 45.24 7.97% 16.57 2.73 1.74 3.85% 64%
TRH Transatlantic Holdings, Inc. 47.69 8.19% 7.70 6.19 0.84 1.76% 14%
SYBT S.Y. BanCorp., Inc.  24.2 8.57% 14.49 1.67 0.72 2.98% 43%
CWT California Water Service 36.73 8.64% 20.29 1.81 1.23 3.35% 68%
NTRS Northern Trust Corp.  49.38 9.01% 18.02 2.74 1.12 2.27% 41%
VLY Valley National BanCorp.  13.47 9.25% 16.63 0.81 0.72 5.35% 89%
HTLF Heartland Financial USA, Inc.  15.1 9.66% 13.36 1.13 0.40 2.65% 35%
CMA Comerica, Inc. 36.31 9.66% 41.26 0.88 0.40 1.10% 45%
AWR American States Water Co. 34.39 10.08% 19.43 1.77 1.04 3.02% 59%
CL Colgate-Palmolive Co. 80.65 10.30% 18.71 4.31 2.32 2.88% 54%
KMB Kimberly-Clark Corp. 66.05 10.88% 14.84 4.45 2.80 4.24% 63%
MRK Merck & Co., Inc 34.04 10.88% 121.57 0.28 1.52 4.47% 543%
23 Companies


Watch List Summary

On the top of our list this week is Westamerica BanCorp (WABC).  According to IQTrends (www.iqtrends.com), this stock is undervalued at 3.5% dividend yield. While the yield of 2.96% doesn't quite get us there, the price-to-book-value of 2.59 is rather interesting because this stock typically trade over 3x book value. See this chart for more details. In addition to that, dividends have been steady throughout this crisis and recovery (see chart).  The payout ratio of 45% implies that earnings can fall 50% and they would still be able to cover the dividend. With next year earnings estimate to be at $3.34 compared to $3.21, we can assume that a dividend cut is unlikely.

Another interesting name is Mercury General (MCY) which trades at a little above 1x book. This is far below the historical average (see chart).  IQTrends estimated that anytime this stock dividend yield reaches 4.5%, it becomes undervalued. The current yield of 6.24% provides almost 40% upside just to get back to undervalued range. This stock would have to rise 150% for it to reach the overvalued range.  The payout ratio of 86% is something to be concerned about.  However, 2009 saw the ratio exceed 100% and yet the company continued to keep the dividend moving along.

Top Five Performance Review

In our ongoing review of the NLO Dividend Watch List, we have taken the top five stocks on our list from April 23, 2010 and have checked their performance one year later. The top five companies on that list can be seen in the table below.
Symbol Name 2010 Price 2011 Price % change
MON Monsanto Co. 65.66 67.52 2.83%
XOM Exxon Mobil Corp.   69.24 86.36 24.73%
LLY Eli Lilly & Co. 35.46 36.26 2.26%
SHEN Shenandoah Telecom 18.00 17.78 -1.22%
T AT&T Inc 26.25 30.68 16.88%


Average 9.09%


DJI Dow Jones Industrial 11,204.28 12,505.99 11.62%
SPX S&P 500 1,217.28 1,337.38 9.87%

The average performance of our top five stocks almost matched the market's performance. Shenandoah (SHEN) underperformed the market and its peer, AT&T (T). This company pays a dividend once a year during November. Any investor looking into this stock should be aware of this. Please note that these figure exclude dividends and are based purely on price appreciation.

Disclaimer:

On our current list, we excluded companies that have no earnings. Stocks that appear on our watch lists are not recommendations to buy. Instead, they are the starting point for doing your research and determining the best company to buy. Ideally, a stock that is purchased from this list is done after a considerable decline in the price and extensive due diligence. We suggest that readers use the March 2009 low (or the companies' most distressed level in the last 2 years) as the downside projection for investing. Our view is to embrace the worse case scenario prior to investing. A minimum of 50% decline or the November 2008 to March 2009 low, whichever is lower, would fit that description. It is important to place these companies on your own watch list so that when the opportunity arises, you can purchase them with a greater margin of safety. It is our expectation that, at the most, only 1/3 of the companies that are part of our list will outperform the market over a one-year period.


Please revisit New Low Observer for edits and revisions to this post. Email us.

Sundry Items

  • Biogen Idec (BIIB) and Teva Pharmaceutical (TEVA) are doing a dance as both are members of the Nasdaq 100 index. As one stock is at a new high the other is reaching a new low. The two-step that is being done by the stocks is quite amazing. Back in October 30, 2009, we pointed out that the concentration of biotech stocks at a new low meant that they were possible takeover candidates. From that list in 2009, GENZ and CEPH were actually tendered buyout offers. 3 of the remaining 5 biotechs have had gains of 40% or more since then. The remaining two stocks, Amgen and Gilead Sciences, are essentially at break even. BIIB has been the leader in terms of price appreciation with a gain of over 100% since October 30, 2009. At that time TEVA was near a new 52-week high. However, BIIB’s recent success is actually impacting the performance of TEVA since both companies are involved in the development in MS drugs. TEVA is now on our new low list for the Nasdaq 100 and should be consider as a top acquisition candidate for your portfolio. Anyone who bought BIIB based on our watch list from October 2009 should now consider securing a large portion of the gains and possibly funding the purchase of TEVA with the proceeds.
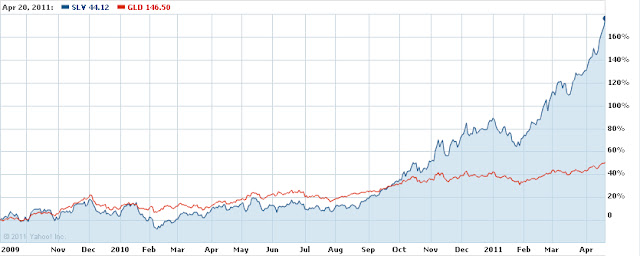
  • Our September 5, 2009 article titled “Silver Should be the Focus” recommended that anyone interested in investing in gold should instead put there investment funds towards silver. The chart below reflecting the silver (SLV) and the gold (GLD) ETF demonstrates the accuracy of our recommendation and highlights what we believe is likely to come. Those interested in determining an entry point should reference our latest article on April 14, 2011 highlighting the downside targets for precious metal stocks based on the Philadelphia Gold and Silver Stock Index (XAU).

  • The results are in and our article titled “A Comparison Between Dividend Strategies” has demonstrated, so far, that the New Low approach has returned 19.52% while the list of stocks we compared ourselves to has returned only 1.39%. We believe that, although the two list have similar companies, the quality and timing has made the difference in performance. As a note, we only made the comparison because the author of the other list indicated that it was for the purpose of trading. In our view, stocks that can be considered for trading are worth comparing since we only aim for 1-year performance.

Please revisit New Low Observer for edits and revisions to this post. Email us.

The Myth of “Inflation Proof” Stocks

As the U.S. experiences record low interest rates, it becomes seemingly obvious that inevitably the next major move is up. What isn’t so obvious is what the impact would be on stocks. Some analysts can definitely see the forest from the trees on this matter. However, having this skill doesn’t automatically mean that navigating that forest is all that easy.
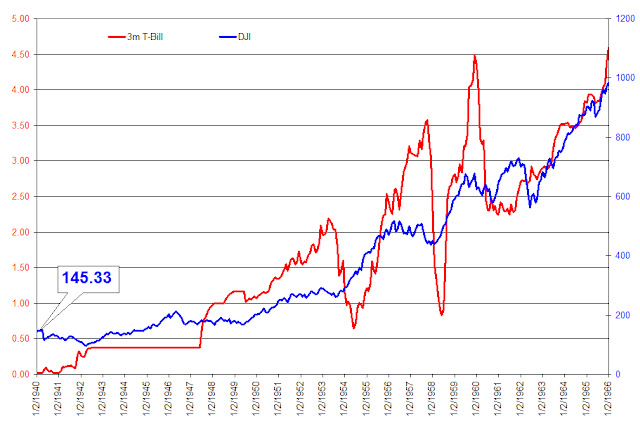
There are two important issues that must be brought to your attention about the forest and the trees in our current investing environment. The first matter (regarding the forest) about rising interest rates is that the bull market in stocks from 1940 to 1966 occurred while rates on 3-month T-bills went from 0.01% in January 1940 to 4.59% in January 1966. The chart below does a side-by-side comparison of rising rates and the Dow Jones Industrial Average. We’re certain that the pervasive thinking is that “this time is different.” However, we wouldn’t want this important fact to remain ignored or glossed over.

The second point (regarding the trees) is that even though inflation is most often represented in the rise of commodity prices, the best investment opportunities may not be in commodity related stocks. To demonstrate this point, we have selected six stocks to compare during a popularly known period of high inflation.

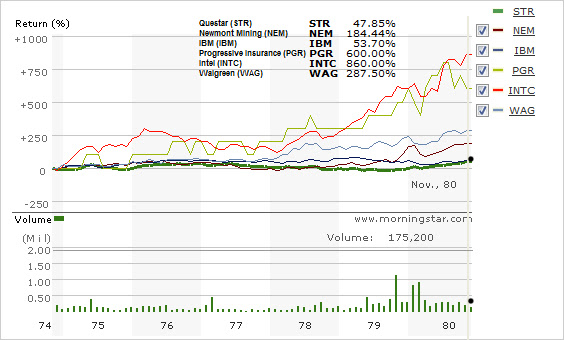
The stocks that we have selected for this comparison are Questar (STR), Newmont Mining (NEM), IBM (IBM), Progressive Insurance (PGR), Intel (INTC), and Walgreen’s (WAG). Two of the stocks are synonymously known as inflation hedges, Questar in the natural gas industry and Newmont Mining in the gold mining industry. The remaining four stocks are a cross-section of almost any economy with insurance, retail, microprocessors and computers being represented.

Unfortunately, our bias towards non-traditional inflation hedges is easily shown when we selected the period from November 1974 to November 1980. However, we wanted to show the performance of stocks, in general, at their lowest point so that there is little confusion about the outcome.

The chart below depicts the total return of all six stocks over the given period in time. Not surprisingly, the stocks most associated with being the best inflation hedge turned out to be among the worst performing. The best performing stock was Intel (INTC) with a gain of 860%. Not far behind Intel was Progressive Insurance (PRG) with a gain of 600%. Walgreen’s came in third with a gain of 287.5% followed by Newmont Mining (NEM) at 184.44% and IBM with 53.7%. Last among the stocks was Questar (STR) with a gain of 47.85%.

While some could rightfully contend that our approach is biased and our conclusions are flawed, we highly recommend that anyone who does their homework and compares the performance of almost any stock with a history of consecutive annual dividend increases to any commodity stock that existed back in the 1970 to 1980 period (on a total return basis), then you’ll be able to arrive at the same conclusions that we did in distinguishing the forest from the trees.

By the way, IBM does not have a long term history of consecutive annual dividend increases which might explain why it couldn’t keep pace in the 1970s.

Please revisit New Low Observer for edits and revisions to this post. Email us.

Canadian Dividend Achievers: April 19, 2011

This list of Canadian Dividend Achievers, published by Mergent's, includes current and former Canadian Dividend Achievers and then ranking the companies based on those closest to the 52-week low as of April 19, 2011. We've updated the stock symbol to connect to the Financial Post, one of Canada's top business publications. You'll find the most complete fundamental information on these companies at the FP website. However, Yahoo!Finance probably has the better long-term charts and historical dividend data.
 
Yahoo Sym.
FP Sym. Name Price P/E EPS P/B % from Low
RCI-B.TO RCI.B Rogers Comm. CL. B 34.32 12.94 2.65 4.82 3.09%
SJR-B.TO SJR Shaw Comm. CL.B 19.64 18.53 1.06 3.07 6.91%
EMP-A.TO EMP.A Empire Co. CL.A 53.67 10.48 5.12 1.15 7.34%
TRI.TO TRI ThomsonReuters 39.1 36.2 1.08 1.7 9.07%
POW.TO POW Power Corp 27.9 14.76 1.89 1.44 11.69%
CP.TO CP Canadian Pacific Railway 60.06 15.6 3.85 2.11 12.11%
CJR-B.TO CJR.B Corus Ent. CL.B, 20.55 14.4 1.43 1.65 12.54%
GWO.TO GWO Great-West Lifeco 26.46 15.15 1.75 2.18 13.22%
PWF.TO PWF Power Financial 30.61 14.58 2.1 1.94 13.37%
FRFHF.PK FFH Fairfax Financial 399.19 18.73 21.31 1.05 14.18%

 
Watch List Performance Review

This performance review will focus on the Canadian Dividend Achievers from our last watch list dated August 20, 2010. Since that time, the entire list has managed to pull off a sizable return of 21.36% in exactly 8 months.

Leading the list was Ensign Energy with a 49.83% return. Not far behind Ensign was Ritchie Brothers Auctioneers with a gain of 40.71%. The worst performing stock on the list was ThomsonReuters with a gain of 6.25% and Power Corp with a gain of 7.18%. Keep in mind that these returns only account for the capital appreciation and do not include the dividend yield at the time the list was generated.
 
FP Symbol
Yahoo Symbol Name 20-Aug-10 19-Apr-11 % change
ESI ESI.TO Ensign Energy Services $11.90 17.83 49.83%
IMO IMO.TO Imperial Oil $38.88 49.06 26.18%
POW POW.TO Power Corp $26.03 27.9 7.18%
RBA RBA.TO Ritchie Bros Auctioneers $18.94 26.65 40.71%
PWF PWF.TO Power Financial Corp. $28.07 30.61 9.05%
GWO GWO.TO Great-West Lifeco Inc. $24.50 26.46 8.00%
IGM IGM.TO IGM Financial $39.15 48 22.61%
CTC.A CTC-A.TO Canadian Tire $54.81 60.53 10.44%
SU SU.TO Suncor Energy $32.68 41.38 26.62%
TLM TLM.TO Talisman Energy $17.25 21.75 26.09%
CNQ CNQ.TO CDN Natural Res. $33.75 43.21 28.03%
IAG IAG.TO Industrial Alliance $30.40 40.46 33.09%
SNC SNC.TO SNC-Lavalin $46.65 53.81 15.35%
TRI TRI.TO ThompsonReuters $36.80 39.1 6.25%
BNS BNS.TO Bank of Nova Scotia $50.85 56.4 10.91%
- - - - - -
- - - - Average: 21.36%
           
    TSX Composite Index 11722.07 13736.83 17.19%
 
The annualized return of the entire list is approximately 30%. For the top 5 stocks on our list, those closest to the low, averaged a gain of 26.59% or an approximate annualized return of 40%. In either case, the gains so far have been exceptional when compared to the S&P/Toronto Stock Exchange which gained 17.19% over the same period.

The New Low Team would like to thank our Canadian readers for continuing to follow this site. If you enjoy the information provided by Art and Touc, then please recommend our site to friends. Thank you.
Please revisit New Low Observer for edits and revisions to this post. Email us.

Nasdaq 100 Watch List: April 15, 2011

Below are the Nasdaq 100 companies that are within 21% of the 52-week low. This list is strictly for the purpose of researching whether or not the companies have viable business models. Although theses companies are very risky, they provide significant opportunity to outperform the market in the coming year.
Symbol Name Price P/E EPS Yield P/B % from Low
CSCO Cisco 17.03 12.88 1.32 1.40% 2.08 0.35%
URBN Urban Outfitters 30.64 19.15 1.6 0 3.65 5.55%
TEVA Teva Pharma 50.01 13.65 3.66 1.70% 2.04 6.43%
AMGN Amgen 55.51 11.59 4.79 0 2.13 10.45%
MSFT Microsoft 25.37 10.83 2.34 2.50% 4.41 11.61%
INTC Intel Corp 19.75 9.83 2.01 3.70% 2.18 12.22%
ATVI Activision 11.23 34.03 0.33 1.50% 1.3 12.41%
SPLS Staples 19.98 16.51 1.21 2.00% 2.08 14.50%
MRVL Marvell Tech 15.97 11.92 1.34 0 1.87 15.14%
INFY Infosys 63.21 24.98 2.53 0.70% 7.32 18.64%
CELG Celgene 56.98 30.31 1.88 0 4.43 18.66%
APOL Apollo Group, Inc. 40.1 15.1 2.66 0 4.3 18.81%
AKAM Akamai 38.09 42.13 0.9 0 3.2 18.92%
QGEN Qiagen N.V. 20.37 33.95 0.6 0 1.88 20.82%


Watch List Performance Review

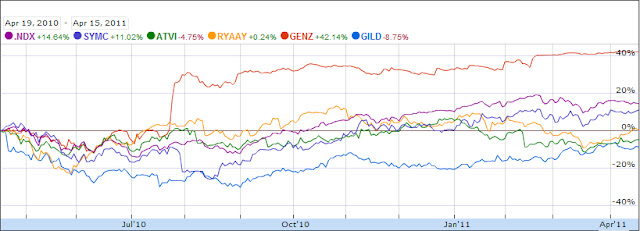
In our review of the Nasdaq 100 Watch List from April 18, 2010, we found that only one company, Genzyme (GENZ), actually outperformed the Nasdaq 100 index.  The remaining 4 companies on the watch list averaged a loss of -0.56%.  When Genzyme (GENZ) is included with the performance of the stocks from last year, the group averaged a gain of 7.98%.

Symbol Name 2010 2011 % Change
GENZ Genzyme 53.64 76.25 42.15%
SYMC Symantec 16.68 18.52 11.03%
RYAAY Ryanair 29.23 29.3 0.24%
ATVI Activision 11.79 11.23 -4.75%
GILD Gilead 45.7 41.7 -8.75%
- - - Average 7.98%
NDX Nasdaq 100 2012.84 2307.58 14.64%

Please revisit New Low Observer for edits and revisions to this post. Email us.

Projecting Downside Targets for Gold and Silver Stocks

In our prior work on the topic of gold and silver, we indicated that the precious metals market had entered into a secular bull market. Our confidence in that thesis was based on the works of Edward Dewey and Edwin Dakins 1947 book titled Cycle: The Science of Prediction. In that book, Dewey and Dakins illustrated the cycles for inflation which indicated that a peak in inflation would occur in 1979 and a trough of inflation would occur around 2006. While the 1979 peak was accurate the 2006 bottom was off by a few years. However, we feel confident that being off by a few years within the context of a 50-year cycle allows for some margin of error.


As investors, the NLO team is primarily concerned with the downside risk and major downside targets. For the gold and silver market, we will use the Philadelphia Gold and Silver Stock Index (XAU) to determine where the next low might occur.


To project the downside target for the XAU, we will use speed resistance lines as pioneered by Edson Gould. William X. Scheinman wrote a piece in Barron’s titled “600 on the Dow” on February 9, 1970 that outlined exactly how Gould’s resistance lines work.


The forecast by Scheinman of a closing low for the Dow at 600 was off by 2.57% when the index closed at 584.56 on October 4, 1974. [As a sidebar, Dow Theory gave a bull market indication in January 1975 that would have investors fully invested.] Although being off by such a small amount, Scheinman also said that the low would occur approximately a year from the date that the article was written. We believe that the tactical error on the part of Scheinman was to expect that the decline would be based strictly on a set time frame rather than based on the level of the resistance line. The chart below is the original piece that was generate by Scheinman from 1970.


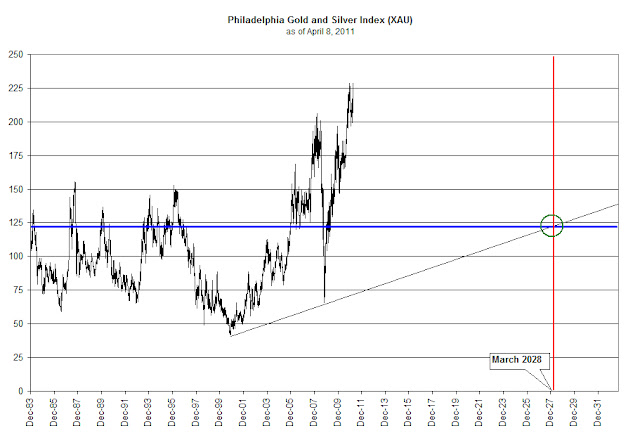
In our chart of the Gold and Silver Stock Index, we have drawn the XAU on a daily basis from 1983 to the present. As described by Scheinman, the counter-trend movement should revert to the speed resistance line or two-thirds of the established high. As an example, the previous peak of the XAU on March 14, 2008 was at the 206.37 level. 206.37 divided by 3 is 68.79. The reversal from the 2008 decline was 65.72 on the XAU. This was within 4.5% of the speed resistance level.


Based on the most recent high of 228.95 the downside target for the XAU index is 76.32. We recommend that whenever the XAU index falls at or below the speed resistance line drawn on the chart, between now and just before 2028, as part of the secular rising trend in interest rates/inflation, we would expect that the stocks in the index are underpriced. Confirmation of fair values should be determined for possible speculative positions at these times.


Note: A variation on this method is to divide the high by three then adding the first major low after the start of the bull market, in this case the October 27,2008 low for the XAU. An example of the usefulness of this technical approach to projecting downside targets can be found by dividing the 2007 top in the Dow Jones Industrial Average (14,164) by three and adding the 1987 low (1738.74). This provided a speed resistance line of 6460.07 which was within 2% of the actual March 9, 2009 low. The blue horizontal line, in our chart of the XAU above, represents the expected downside target when adding the October 2008 low to the speed resistance line.
Please revisit New Low Observer for edits and revisions to this post. Email us.

Investment Observation: Simmons First National Corp (SFNC) at $26.65

For better or worse, we expect that regional financial crises will emerge as the dominant investment theme going forward. After having devastated our economy on a national basis, with the use of derivatives and residential real estate, the time has come for the old-fashion regional boom and busts of old.
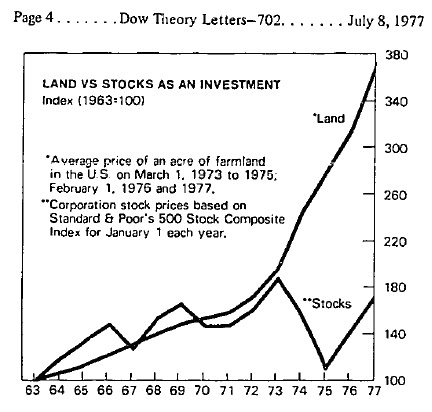
With the secular trend towards inflation, as reflected in the rise in gold, silver and all other commodities, we should expect that farmland in the U.S. will ultimately take a parabolic trajectory. The gradual rise in prices of farmland by large investors will attract retail buyers. Unlike large investors, retail buyers of farmland will need to borrower heavily to participate in the speculation. Unfortunately, it will be because of the retail buyers that the boom will go to extremes. The chart below demonstrates the last farmland boom during a secular bull market in commodities.
Source: Richard Russell's Dow Theory Letters, http://www.dowtheoryletters.com/
On the way to a speculative surge and inevitable bust of the farmland boom, financial institutions will likely have to play a more significant role in financing it. To that end, we present a former Dividend Achiever that is currently on our Dividend watchlist, Simmons First National Corp (SFNC). Simmons First National is likely to become one of the many lending institutions that will play a role in financing the coming boom in commodities. From farmland to farm equipment, SFNC will definitely be in the mix. Unlike the banking institutions that will eventually arrive at the party, as an Arkansas bank, Simmons First National is already situated to play a contributing role.
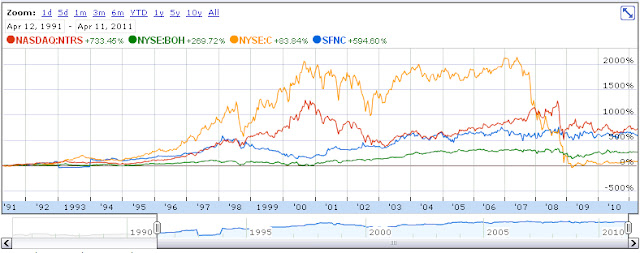
Simmons has all the qualitative elements that a true value investor would want like falling only 20% in the period from 2007 to 2009 as compared to other regional banks as a group which fell over 70% as indicated by Standard & Poor’s Quantitative Stock Report dated April 8, 2011. SFNC has managed to keep the dividend at the same level since 2008 which is no small feat. Book value has increased 6.5% over the last 5 years.
Value Line Investment Survey dated March 11, 2011 indicates that SFNC has a high predictability in their earnings which have gained 3% in the last 5 years and while the last year of earnings have declined –9%. Investors should not confuse falling earnings with no earnings at all. Over emphasis of a companies declining earnings is often what creates value in the price of a stock for those unable to make this distinction.
Because SFNC has traded in a range between $20 and $30 since 2004, there is an implied element of value that has accrued in the shares. If nothing else, the management of SFNC has managed to dodge the banking crisis bullet and is now poised to participate in the coming boom in farmland as part of the bull market in commodities.

Please revisit New Low Observer for edits and revisions to this post. Email us.

NLO Dividend Watch List

The market was relatively flat this week. We are (cautiously) bullish going into next week after the Dow Theory re-confirmation of the cyclical bull market. Read more on that here.
Our watch list this week contains 20 companies that are within 11% of their 52-week low.

April 8, 2011 Watch List

Symbol Name Price % Yr Low P/E EPS (ttm) Dividend Yield Payout Ratio
TGT Target Corp. 49.53 2.70% 12.38 4.00 1.00 2.02% 25%
SJW SJW Corp. 22.94 3.10% 17.65 1.30 0.69 3.01% 53%
SYY Sysco Corp. 28.07 3.46% 14.47 1.94 1.04 3.71% 54%
HCBK Hudson City Bancorp, Inc. 9.87 3.79% 9.06 1.09 0.60 6.08% 55%
WABC Westamerica BanCorp.  50.73 4.17% 15.80 3.21 1.44 2.84% 45%
BMI Badger Meter, Inc. 37.98 4.23% 19.88 1.91 0.56 1.47% 29%
JNJ Johnson & Johnson   59.46 4.57% 12.44 4.78 2.16 3.63% 45%
MCY Mercury General Corp. 39.44 5.77% 14.19 2.78 2.40 6.09% 86%
WEYS Weyco Group, Inc.  24.02 7.76% 20.18 1.19 0.64 2.66% 54%
CHFC Chemical Financial Corp.  20.27 7.88% 23.03 0.88 0.80 3.95% 91%
HGIC Harleysville Group Inc.  32.70 7.89% 13.51 2.42 1.44 4.40% 60%
NWN Northwest Natural Gas Co. 45.44 8.45% 16.64 2.73 1.74 3.83% 64%
PPL PP&L Corporation 25.87 8.93% 11.98 2.16 1.40 5.41% 65%
PEP PepsiCo Inc. 65.73 8.97% 16.77 3.92 1.92 2.92% 49%
MRK Merck & Co., Inc 33.67 9.67% 120.25 0.28 1.52 4.51% 543%
KMB Kimberly-Clark Corp. 65.43 9.84% 14.70 4.45 2.80 4.28% 63%
WMT Wal-Mart Stores, Inc. 52.54 9.99% 11.78 4.46 1.46 2.78% 33%
BOH Bank of Hawaii Corp. 47.28 10.11% 12.44 3.80 1.80 3.81% 47%
CWT California Water Service 37.30 10.32% 20.61 1.81 1.23 3.30% 68%
SFNC Simmons First National Corp.  26.75 10.63% 12.44 2.15 0.76 2.84% 35%
20 Companies


Watch List Summary

On the top of our list this week is Target (TGT).  Again, according IQTrend this stock offers tremendous upside potential gauging by the relative dividend yield. Historically, shares are undervalue at 1% yield. With the stock trading at 2% yield, it has the potential to double, all else being equal.
If you are concern about inflation and looking for an investment as a derivative of that thesis, take a look at Sysco (SYY). Not much has changed since we wrote about it in 2008 (article here). Quick highlight is that SYY is an inflation hedge. Short-term, their ability to pass on costs to customer is limited but eventually those cost get passed on.
Notable to this list is the financial sector. There are about 5 companies, that's a quarter of this list. Including insurance companies and you get 7. Something to explore as a sign of a low in the industry.
Another sector is utilities. There are 4 companies on this list.
No longer on our list is Abbott Lab (ABT). Which rose 2.25% this week and closed above $50. The last time Abbott traded above that level was November 2010.

Top Five Performance Review

In our ongoing review of the NLO Dividend Watch List, we have taken the top five stocks on our list from April 9, 2010 and have checked their performance one year later. The top five companies on that list can be seen in the table below.

Symbol Name 2010 Price 2011 Price % change
MON Monsanto Co. 68.85 66.22 -3.82%
DNB Dun & Bradstreet Corp. 74.49 80.73 8.38%
XOM Exxon Mobil Corp.   68.76 85.95 25.00%
TMP Tompkins Financial Corp. 37.55 41.31 10.01%
FPL FPL Group, Inc. 49.71 56.00 12.65%


Average 10.44%


DJI Dow Jones Industrial 10,997.35 12,380.05 12.57%
SPX S&P 500 1,194.37 1,328.17 11.20%

The average performance of our top five stocks almost matched the market's performance. Please note that these figure exclude dividends and are based purely on price appreciation. Monsanto (MON) weighted down our watch list after reporting their quarterly earning on Wednesday.

Disclaimer:
On our current list, we excluded companies that have no earnings. Stocks that appear on our watch lists are not recommendations to buy. Instead, they are the starting point for doing your research and determining the best company to buy. Ideally, a stock that is purchased from this list is done after a considerable decline in the price and extensive due diligence. We suggest that readers use the March 2009 low (or the companies' most distressed level in the last 2 years) as the downside projection for investing. Our view is to embrace the worse case scenario prior to investing. A minimum of 50% decline or the November 2008 to March 2009 low, whichever is lower, would fit that description. It is important to place these companies on your own watch list so that when the opportunity arises, you can purchase them with a greater margin of safety. It is our expectation that, at the most, only 1/3 of the companies that are part of our list will outperform the market over a one-year period.

Please revisit New Low Observer for edits and revisions to this post. Email us.

Richard Russell’s Miscue

On the Dow Theory Letters (http://www.dowtheoryletters.com/) site yesterday, there was an interesting admission by Richard Russell. Russell said:
“I mistakenly took the vicious decline of 2007 to 2009 as a turn in the tide and a bear market.”
This comes as a shock since most market veterans would say that when almost every market, foreign and domestic, declines by 30% or more then it would be sufficient to label it as a bear market. When the gold stock index (XAU) declines 62% along with almost all other commodity indexes then a reasonable person, lacking any other term for it, would call that a bear market.
Instead of being a bear market, according to Russell, the decline from 2007 to 2009 was simply a “…correction in an ongoing bull market.” As I attempted to process this thought, I only wonder what Russell would re-characterize the stock market decline in Japan (from the 38,000 to 8,000 level) as. Dow theorists like Hamilton, Rhea and many others are very clear on what constitutes a bear market. Russell’s assertion that 2007 to 2009 was simply a “correction” was in complete contradiction to his prescient call of an eminent bear market in Barron’s in November 2007. Nor does Russell’s latest missive add credibility to his prior claims that the rise in the market from the 2003 low was a bear market rally.
To top off Richard Russell’s wild claim that a year and a half decline of over 40% in global equity price was only a “correction” is the fact that he omitted any reference to Dow Theory having any role in his sudden realization that he was wrong about his belief that we were only in a correction rather than a bear market. Russell credited his not so secret Primary Trend Indicator, Lowry’s Selling Pressure Index and Lowry’s Buying Power Index. Apparently, Dow Theory plays a small or non-existent role in a publication that is titled The Dow Theory Letters.
By inference, not crediting Dow Theory for his change in thinking suggests that Dow Theory doesn’t work. However, the NLO team has been adamant that up to this point, Dow Theory has indicated that we’re in a bull market and that a bear market has not been signaled since the July 23, 2009 bull market indication. This is in stark contrast to Russell’s back and forth calls of a bull and bear market as early as January 2009.
So what is Russell’s remedy for his error in judgment for the last 2 years? In today’s note (April 6, 2011) Russell says, “If this market is going to turn primary bearish, I would want to see an orthodox Dow Theory bear signal.” Wait a minute, as the market was rising Russell arbitrarily misapplied his version of Dow Theory and now he thinks that he’ll turn bearish when he receives “…an orthodox Dow Theory bear signal.”
As an attempt to salvage some sort of credibility Russell says, “In the meantime, all is not lost. Gold is at new highs as are the gold ETFs, and silver is at a 31-year high.” This comes after Russell said on March 1, 2011 that if the Dow Industrials fall below 11,800 then investors should sell all stocks “including gold stocks." Well, on March 16, 2011, the Dow fell to 11,600 leaving anyone who believed Russell’s commentary on March 1, 2011 in the lurch.
The NLO team is disappointed since Richard Russell has been the primary inspiration for our work in Dow Theory and critically analyzing financial markets. In addition, we’d rather have Russell retire as a legend with a legacy that will continue to inspire. However, Russell’s latest work comes off as sloppy and requires significant willingness to view his work as entertainment, at best.
 
Please revisit New Low Observer for edits and revisions to this post. Email us.