Members
-
Topics
Archives
-
-
Recent Posts
-
-
-
Investor Education
Market Return After Exceptional Years
Dollar Cost Averaging Tool
Dow Theory: The Formation of a Line
Dividend Capture Strategy Analysis
Golden Cross – How Golden Is It?
Debunked – Death Cross
Work Smart, Not Hard
Charles H. Dow, Father of Value Investing
It's All About the Dividends
Dow Theory: Buying in Scales
How to Avoid Losses
When Dividends are Canceled
Cyclical and Secular Markets
Inflation Proof Myth
What is Fair Value?
Issues with P-E Ratios
Beware of Gold Dividends
Gold Standard Myth
Lagging Gold Stocks?
No Sophisticated Investors
Dollar down, Gold up?
Problems with Market Share
Aim for Annualized Returns
Anatomy of Bear Market Trade
Don’t Use Stop Orders
How to Value Earnings
Low Yields, Big Gains
Set Limits, Gain More
Ex-Dividend Dates -
-
Historical Data
1290-1950: Price Index
1670-2012: Inflation Rate
1790-1947: Wholesale Price Cycle
1795-1973: Real Estate Cycle
1800-1965: U.S. Yields
1834-1928: U.S. Stock Index
1835-2019: Booms and Busts
1846-1895: Gold/Silver Value
1853-2019: Recession/Depression Index
1860-1907: Most Active Stock Average
1870-2033: Real Estate Cycles
1871-2020: Market Dividend Yield
1875-1940: St. Louis Rents
1876-1934: Credit-New Dwellings
1896-1925: Inflation-Stocks
1897-2019: Sentiment Index
1900-1903: Dow Theory
1900-1923: Cigars and Cigarettes
1900-2019: Silver/Dow Ratio
1901-2019: YoY DJIA
1903-1907: Dow Theory
1906-1932: Barron's Averages
1907-1910: Dow Theory
1910-1913: Dow Theory
1910-1936: U.S. Real Estate
1910-2016: Union Pacific Corp.
1914-2012: Fed/GDP Ratio
1919-1934: Barron's Industrial Production
1920-1940: Homestake Mining
1921-1939: US Realty
1922-1930: Discount Rate
1924-2001: Gold/Silver Stocks
1927-1937: Borden Co.
1927-1937: National Dairy Products
1927-1937: Union Carbide
1928-1943: Discount Rate
1929-1937: Monsanto Co.
1937-1969: Intelligent Investor
1939-1965: Utility Stocks v. Interest Rates
1941-1967: Texas Pacific Land
1947-1970: Inventory-Sales Ratio
1948-2019: Profits v. DJIA
1949-1970: Dow 600? SRL
1958-1976: Gold Expert
1963-1977: Farmland Values
1971-2018: Nasdaq v. Gold
1971-1974: REIT Crash
1972-1979: REIT Index Crash
1986-2018: Hang Seng Index Cycles
1986-2019: Crude Oil Cycles
1999-2017: Cell Phone Market Share
2008: Transaction History
2010-2021: Bitcoin Cycles -
Interesting Read
Inside a Moneymaking Machine Like No Other
The Fuzzy, Insane Math That's Creating So Many Billion-Dollar Tech Companies
Berkshire Hathaway Shareholder Letters
Forex Investors May Face $1 Billion Loss as Trade Site Vanishes
Why the oil price is falling
How a $600 Million Hedge Fund Disappeared
Hedge Fund Manager Who Remembers 1998 Rout Says Prepare for Pain
Swiss National Bank Starts Negative
Tice: Crash is Coming...Although
More on Edson Gould (PDF)
Schiller's CAPE ratio is wrong
Double-Digit Inflation in the 1970s (PDF)
401k Crisis
Quick Link Archive
Author Archives: NLObserver Team
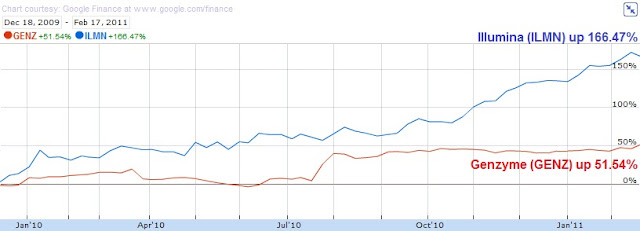
Illumina Shines After Appearing on Watch List
New Low Team Nails it on Genzyme Deal
"Finally we have Genzyme Corp. (GENZ) at $55.94. This stock has historically traded at 19 times cashflow. The 2008 cashflow for this GENZ was $2.82, according to Mergent’s (Valueline had the higher figure.) GENZ, although selling 19% above the 52-week low, is a far superior value proposition. The shares outstanding have grown by 2.7% from 2006 to 2008 while the long-term debt has fallen by 85% over the same time frame."
We hope that the work we have done on this site is evidence of the soundness of our strategy. Tomorrow we will outline another stock from our Nasdaq 100 Watch List that has made the Genzyme deal look like peanuts in comparison.
Speculation Observation: Cephalon at $58.99
Article Links:
- Caris and Co. Downgrade of Cephalon
- Jefferies and Co. Downgrade of Cephalon
- NLO August 2009 Speculation Observation
- NLO October 2009 Speculation Observation
- NLO January 2010 Speculative Observation
- NLO March 2010 Sell Recommendation
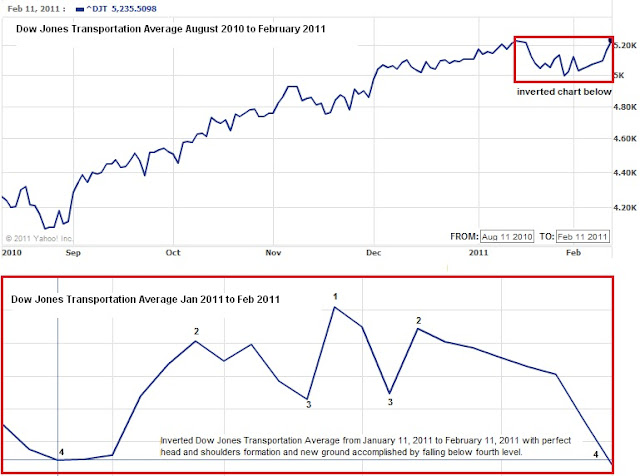
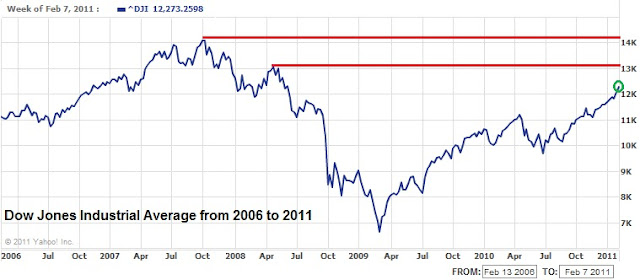
Dow Theory: Continuation of Bull Market Confirmed
NLO Dividend Watch List
| Symbol | Name | Price | % Yr Low | P/E | EPS (ttm) | Dividend | Yield | Payout Ratio |
| ABT | Abbott Laboratories | 45.56 | 2.18% | 15.39 | 2.96 | 1.76 | 3.86% | 59% |
| SYY | Sysco Corp. | 28.24 | 4.09% | 14.48 | 1.95 | 1.04 | 3.68% | 53% |
| PPL | PP&L Corporation | 24.75 | 4.21% | 13.67 | 1.81 | 1.40 | 5.66% | 77% |
| WABC | Westamerica BanCorp. | 51.00 | 4.72% | 15.89 | 3.21 | 1.44 | 2.82% | 45% |
| MCY | Mercury General Corp. | 40.07 | 5.73% | 10.46 | 3.83 | 2.40 | 5.99% | 63% |
| PEP | PepsiCo Inc. | 63.87 | 5.89% | 16.09 | 3.97 | 1.92 | 3.01% | 48% |
| HCBK | Hudson City Bancorp | 11.48 | 6.30% | 10.53 | 1.09 | 0.60 | 5.23% | 55% |
| AWR | American States Water | 33.22 | 6.34% | 22.60 | 1.47 | 1.04 | 3.13% | 71% |
| CWT | California Water Service | 36.04 | 6.60% | 19.07 | 1.89 | 1.23 | 3.41% | 65% |
| JNJ | Johnson & Johnson | 60.70 | 6.75% | 12.70 | 4.78 | 2.16 | 3.56% | 45% |
| CAG | ConAgra Foods, Inc. | 22.52 | 7.14% | 15.11 | 1.49 | 0.92 | 4.09% | 62% |
| MRK | Merck & Co., Inc | 33.07 | 7.72% | 118.11 | 0.28 | 1.52 | 4.60% | 543% |
| LLY | Eli Lilly & Co. | 34.52 | 7.81% | 7.54 | 4.58 | 1.96 | 5.68% | 43% |
| CL | Colgate-Palmolive Co. | 78.92 | 7.93% | 18.31 | 4.31 | 2.12 | 2.69% | 49% |
| WEYS | Weyco Group, Inc. | 24.36 | 9.98% | 21.18 | 1.15 | 0.64 | 2.63% | 56% |
| NWN | Northwest Natural Gas | 45.36 | 9.49% | 16.14 | 2.81 | 1.74 | 3.84% | 62% |
| 16 Companies | ||||||||
Abbott (ABT) topped our list again this week. Again we speculate that the company could easily raise its dividend from $0.44 to $0.48 (9% increase) in the coming months. At current price, estimated dividend yield will be north of 4%. Sysco (SYY) took a hit after the earning came short of analyst estimate. Shares fell 3.25% since last watch list.
Top Five Performance Review
In our ongoing review of the NLO Dividend Watch List, we have taken the top five stocks on our list from February 19, 2010 and have check their performance one year later. The top five companies on that list can be seen in the table below.
| Name | Symbol | 2010 Price | 2011 Price | % change |
| First Financial Corp. | THFF | 26.49 | 32.1 | 21.18% |
| EXXON MOBIL CP | XOM | 64.8 | 82.82 | 27.81% |
| CALIFORNIA WATER | CWT | 35.92 | 36.04 | 0.33% |
| AMER ST WATER | AWR | 32.05 | 33.22 | 3.65% |
| AQUA AMERICA INC | WTR | 16.59 | 23.43 | 41.23% |
| Average | 18.84% | |||
| Dow Jones Industrial | DJI | 10,099.14 | 12,273.29 | 21.53% |
| S&P 500 | SPX | 1,075.51 | 1,329.15 | 23.58% |
Disclaimer
On our current list, we excluded companies that have no earnings. Stocks that appear on our watch lists are not recommendations to buy. Instead, they are the starting point for doing your research and determining the best company to buy. Ideally, a stock that is purchased from this list is done after a considerable decline in the price and extensive due diligence. We suggest that readers use the March 2009 low (or the companies' most distressed level in the last 2 years) as the downside projection for investing. Our view is to embrace the worse case scenario prior to investing. A minimum of 50% decline or the November 2008 to March 2009 low, whichever is lower, would fit that description. It is important to place these companies on your own watch list so that when the opportunity arises, you can purchase them with a greater margin of safety. It is our expectation that, at the most, only 1/3 of the companies that are part of our list will outperform the market over a one-year period.
Please revisit New Low Observer for edits and revisions to this post. Email us.
Nasdaq 100 Watch List
Below are the Nasdaq 100 companies that are within 20% of the 52-week low. This list is strictly for the purpose of researching whether or not the companies have viable business models. Although theses companies are very risky, they provide significant opportunity to outperform the market in the coming year.
| Symbol | Name | Price | P/E | EPS | Yield | P/B | % From Low |
| CELG | Celgene Corp | $51.29 | 27.28 | 1.88 | 0 | 4.42 | 6.81% |
| CEPH | Cephalon | $59.96 | 11.2 | 5.35 | 0 | 1.81 | 9.02% |
| QGEN | Qiagen N.V. | $18.48 | 29.06 | 0.64 | 0 | 1.77 | 9.61% |
| AMGN | Amgen | $55.20 | 11.52 | 4.79 | 0 | 2.16 | 9.83% |
| TEVA | Teva Pharma. | $54.10 | 16.65 | 3.25 | 1.30% | 2.26 | 15.13% |
| CSCO | Cisco Systems | $22.05 | 16.09 | 1.37 | 0 | 2.73 | 16.05% |
| ATVI | Activision | $11.74 | 39.93 | 0.29 | 1.30% | 1.31 | 17.52% |
| URBN | Urban Outfitters | $34.76 | 21.6 | 1.61 | 0 | 4.21 | 19.74% |
The following is the order that we think the watch list companies might perform over the next year (from best to worst on a percentage basis) and our thoughts on the reasons why.
-
Celgene (CELG): Celgene has no debt, strong earnings growth, while the book value has increased nearly 50% in the last 5 years.
-
Urban Outfitter (URBN): This clothing retailer has no debt and a book value increase of nearly 24% in the last ten years. We do not expect the same growth rate of the book going forward since the fashion industry is so fickle.
-
Teva Pharmaceutical (TEVA): Although saddled with some debt, this Israeli based pharmaceutical company is undervalued on a cash flow basis by 23% according to Value Line.
-
Cisco Systems (CSCO): One drawback for Cisco Systems is its management team which appears highly compensated for lackluster performance in the stock price. Despite this concern, CSCO has reduced the shares outstanding by nearly 23% since 2001. However, this may be a result of the large amount of debt that has been taken on since 2006. Such borrowing may be prudent given the current low interest rate environment. The book value for CSCO has grown almost 12% annually over the last 10 years.
-
Amgen (AMGN): Amgen has reduced the shares outstanding by nearly 23% since 2002. Unfortunately, the share reduction has been at the expense of a nearly 250% increase of long-term debt in the same period of time. According to Value Line dated December 17, 2010, AMGN normally trades around 12 times cash flow. Using the most conservative numbers provided by Value Line, AMGN should be selling at $72 a share instead of the current price of $55.20.
-
Cephalon (CEPH): There is a severe disconnect with Cephalon and the stock market. CEPH shares trade at less than the 2001 high. According to Value Line, the annualized growth rate of the book value over the same period has been 26%. The company’s debt has remained relatively steady while the number of shares outstanding has grown by “only” 7.6% annually. CEPH should be selling for at least $76 if the numbers on this company are accurate.
Watch List Performance Review
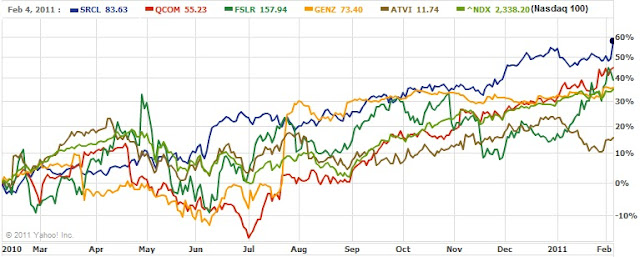
In our ongoing review of the Nasdaq 100 Watch List, we have taken the stocks from our list of February 7, 2010 (article here) and have checked their performance one year later. The companies on that list are provided below with the closing price for February 5, 2010 and February 4, 2011.
| Symbol | Name | 2010 | 2011 | % change | |||||||
| SRCL | Stericycle | $52.00 | $83.63 | 60.83% | |||||||
| QCOM | QUALCOMM | $38.04 | $55.23 | 45.19% | |||||||
| FSLR | First Solar | $114.19 | $157.94 | 38.31% | |||||||
| GENZ | Genzyme | $55.17 | $73.40 | 33.04% | |||||||
| ATVI | Activision Blizzard | $10.21 | $11.74 | 14.99% | |||||||
| ERTS | Electronic Arts | $17.26 | $18.23 | 5.62% | |||||||
| GILD | Gilead Sciences | $46.38 | $38.79 | -16.36% | |||||||
| APOL | Apollo Group | $59.93 | $42.14 | -29.68% | |||||||
| Average | 18.99% | ||||||||||
NLO Dividend Watch List
The Dow hit 12,000 intra-week but closed decisively lower at 11,823. The S&P 500 was flat for the week. Our watch list has 16 companies that are within 10% of their 52-week low.
January 28, 2011 Watch List
| Symbol | Name | Price | % Yr Low | P/E | EPS (ttm) | Dividend | Yield | Payout Ratio |
| ABT | Abbott Laboratories | 45.49 | 2.02% | 15.01 | 3.03 | 1.76 | 3.87% | 58% |
| WABC | Westamerica BanCorp. | 50.13 | 2.94% | 15.62 | 3.21 | 1.44 | 2.87% | 45% |
| WEYS | Weyco Group, Inc. | 22.78 | 3.03% | 19.64 | 1.16 | 0.64 | 2.81% | 55% |
| SHEN | Shenandoah Telecom. | 16.31 | 4.82% | 17.92 | 0.91 | 0.33 | 2.02% | 36% |
| CL | Colgate-Palmolive Co. | 76.99 | 5.29% | 17.99 | 4.28 | 2.12 | 2.75% | 50% |
| JNJ | Johnson & Johnson | 60.01 | 5.54% | 12.32 | 4.87 | 2.16 | 3.60% | 44% |
| CAG | ConAgra Foods, Inc. | 22.44 | 6.76% | 15.06 | 1.49 | 0.92 | 4.10% | 62% |
| NWN | Northwest Natural Gas | 44.02 | 7.24% | 15.72 | 2.80 | 1.74 | 3.95% | 62% |
| UVV | Universal Corp. | 37.99 | 7.44% | 7.46 | 5.09 | 1.92 | 5.05% | 38% |
| MRK | Merck & Co., Inc | 33.07 | 7.72% | 12.77 | 2.59 | 1.52 | 4.60% | 59% |
| CLX | Clorox Co. | 63.79 | 8.10% | 13.72 | 4.65 | 2.20 | 3.45% | 47% |
| SYY | Sysco Corp. | 29.19 | 8.15% | 14.97 | 1.95 | 1.04 | 3.56% | 53% |
| CWT | California Water Service | 36.58 | 8.19% | 19.35 | 1.89 | 1.19 | 3.25% | 63% |
| LLY | Eli Lilly & Co. | 34.77 | 8.59% | 7.97 | 4.36 | 1.96 | 5.64% | 45% |
| AWR | American States Water | 33.9 | 8.65% | 23.06 | 1.47 | 1.04 | 3.07% | 71% |
| PEP | PepsiCo Inc. | 64.4 | 9.62% | 16.22 | 3.97 | 1.92 | 2.98% | 48% |
| 16 Companies | ||||||||
Watch List Summary
Abbott (ABT) topped our list this week after falling 5%. Wall Street wasn't happy with the company's short-term outlook even after the company guided for double digit growth in the coming year. With Abbott trading close to its historically high yield, we couldn't help but to accumulate some on its way down. Given an estimated double digit growth, we speculate that the company could easily raise its dividend from $0.44 to $0.48 (9% increase) in the coming months. At current price, estimated dividend yield will be north of 4%.
Some other noteworthy names on this list are Colgate-Palmolive (CL), Johnson & Johnson (JNJ), Clorox (CLX), Sysco (SYY), and Pepsi (PEP). All of them have dividend yield that are higher than 7-year T-Bill and are trading near their historical high yield. According to the book, Dividends Don't Lie by Geraldine Weiss, this mark great value proposition for long-term holder.
Top Five Performance Review
In our ongoing review of the NLO Dividend Watch List, we have taken the top five stocks on our list from January 29, 2010 and have check their performance one year later. The top five companies on that list can be seen in the table below.
| Name | Symbol | 2010 Price | 2011 Price | % change |
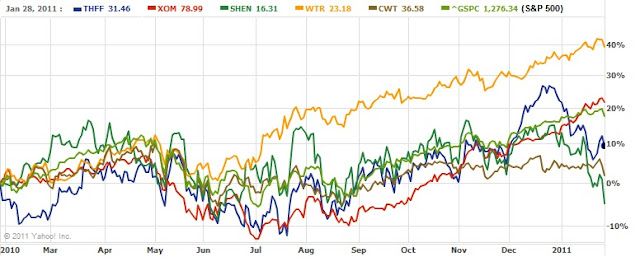
| First Financial Corp. | THFF | 27.6 | 31.46 | 13.99% |
| Exxon Mobile | XOM | 64.43 | 78.99 | 22.60% |
| Shenandoah Telecom | SHEN | 17.2 | 16.31 | -5.17% |
| Aqua America | WTR | 16.59 | 23.18 | 39.72% |
| California Water | CWT | 36.32 | 36.58 | 0.72% |
| Average | 14.37% | |||
| Dow Jones Industrial | DJI | 10,067.33 | 11,823.70 | 17.45% |
| S&P 500 | SPX | 1,073.87 | 1,276.34 | 18.85% |
Our top five under performed both the Dow and S&P. Only Exxon (XOM) and Aqua America (WTR) beat those two indices. Although Shenandoah (SHEN) fell 5% over one-year, it rose above 15% in less than two months, giving investors an opportunity to take some profit off the table.
Disclaimer
On our current list, we excluded companies that have no earnings. Stocks that appear on our watch lists are not recommendations to buy. Instead, they are the starting point for doing your research and determining the best company to buy. Ideally, a stock that is purchased from this list is done after a considerable decline in the price and extensive due diligence. We suggest that readers use the March 2009 low (or the companies' most distressed level in the last 2 years) as the downside projection for investing. Our view is to embrace the worse case scenario prior to investing. A minimum of 50% decline or the November 2008 to March 2009 low, whichever is lower, would fit that description. It is important to place these companies on your own watch list so that when the opportunity arises, you can purchase them with a greater margin of safety. It is our expectation that, at the most, only 1/3 of the companies that are part of our list will outperform the market over a one-year period.
Market Review and Analysis
Posted in 4 1/2 year, 4 year, Coppock Curve, Dow Theory, gold, Richard Russell
Tagged members
Nasdaq 100 Watch List
| Symbol | Name | Trade | P/E | EPS | Yield | P/B | % from Low |
| CEPH | Cephalon, Inc. | 59.64 | 11.14 | 5.35 | N/A | 1.81 | 8.44% |
| CSCO | Cisco Systems, Inc. | 20.73 | 15.13 | 1.37 | N/A | 2.59 | 9.08% |
| QGEN | Qiagen N.V. | 18.56 | 29.18 | 0.64 | N/A | 1.8 | 10.08% |
| TEVA | Teva Pharmaceutical | 52.86 | 16.27 | 3.25 | 1.30% | 2.23 | 12.49% |
| ATVI | Activision Blizzard, Inc | 11.25 | 38.25 | 0.29 | 1.30% | 1.29 | 13.24% |
| AMGN | Amgen Inc. | 56.97 | 12.31 | 4.63 | N/A | 2.27 | 13.35% |
| CELG | Celgene Corporation | 56.03 | 28.3 | 1.98 | N/A | 5.06 | 16.68% |
| GRMN | Garmin Ltd. | 30.79 | 8.42 | 3.66 | 4.90% | 2.11 | 17.92% |
| INTC | Intel Corporation | 20.82 | 10.16 | 2.05 | 3.00% | 2.34 | 18.30% |
| DELL | Dell Inc. | 13.47 | 12.95 | 1.04 | N/A | 3.85 | 18.78% |
Watch List Performance Review
|
Symbol
|
Company
|
2010
|
2011
|
% change
|
|||
|
First Solar
|
112.39
|
147.41
|
31.16%
|
||||
|
Gilead Sci.
|
46.08
|
38.19
|
-17.12%
|
||||
|
Genzyme
|
54.38
|
71.58
|
31.63%
|
||||
|
Apollo Grp
|
61.19
|
42.35
|
-30.79%
|
||||
|
Electronic Arts
|
16.77
|
15.13
|
-9.78%
|
||||
|
Average Gain
|
1.02%
|
||||||
|
NDX
|
Nasdaq 100
|
1794.82
|
2268.32
|
26.38%
|
|||
Disclaimer
Federal Reserve Isn’t to Blame for the Current Market Run
The phrase “this time is different” is often associated with a blithe understanding of the past and an unwillingness to accept time tested facts. Most often this phrase is uttered at stock market tops as an indication that basic rules of economics no longer apply. Unfortunately, there is a back door reference to “this time being different” when market analysts, of the bearish perspective, make claims that this “exceptional” market run is being fuel by the Federal Reserve.
The thought is that, with all the printing of money and “quantitative easing”, the only reason that the market could possibly rise as much as it has is because of the Federal Reserve. In this piece, we’re going to show that Fed or not, the market, after a large decline of nearly -50% in one stretch, retracing +50% to +100% of the prior losses is typical of the market.
Starting with the period from 1861, the average price of the ten leading stocks (rails), based on trading volume, went from the level of 50 to as high as 141 in early 1864. The subsequent decline from 141 in 1864 to as low as 43 incurred a loss of -69% by 1877. The following rise, from 43 in 1864 to the level of 121 in 1881 was an increase of over +79%.
After the 1881 peak in the ten leading stocks at the 121 level, the stock average promptly dropped to the 65 level in 1884, a loss of over -46%. The rise in the ten leading stocks from the bottom in 1884 took the index to 102 in 1890, or an increase of +66%.
The peak of 1890 at 102 was quickly followed by a decline of the leading stocks to 60, a decline of -41%. After trading in a tight range until 1898, the leading stocks rose to 180 by 1905, a gain of +200% in eight years.
The preceding examples were derived from the book “Wall Street and the stock markets: A chronology (1644-1971)” by Peter Wyckoff on pages 38 and pages 39. For those interested, Wyckoff specifics exactly which stocks were initially included in the leading stocks and which stocks were added and dropped in the period following.
Switching to the Dow Industrials from 1906 to 1922. Below, we are republishing the data from our timely article dated February 12, 2009 titled “Misinformed Market Observations” (found here). In that article we show that declines of -40% or more resulted in rebounds of +50% to +100% of the previous decline.
-
Jan 19, 1906 to Nov. 15, 1907 decline of -48.3%
-
Nov. 15, 1907 to Nov. 19, 1909 increase of +89%
-
Sept. 30, 1912 to Dec. 24, 1914 decline of -43%
-
Dec. 24, 1914 to Nov. 21, 1916 increase of +107%
-
Nov. 21, 1916 to Dec. 19, 1917 decline of -40%
-
Dec. 19, 1917 to Nov. 03, 1919 increase of +81%
-
Nov. 3, 1919 to Aug. 24, 1921 decline of –46%
-
Aug. 24, 1921 to Oct. 14, 1922 increase of +61%
The most important element that should be taken away from all this data is that the current Federal Reserve did not exist prior to January 1914. There was no way to ascribe the gains of the market to a central bank. All iterations of a central bank with the First Bank of the United States (1791-1811) and the Second Bank of the United States (1816-1836) did not have any effect on the data sets that we have provide from the period of 1860 to 1914. In order for the claim that the current market run is based on the monetary policies of the Federal Reserve, we’d need to be able to demonstrate that the stock market would have performed differently without the existence of a Federal Reserve.
Unfortunately, those that claim “this time is different” aren’t trying hard enough to prove their claim false. A cursory review of market data during the periods from 1860 to 1914 makes it clear that declines of nearly -50% or more are likely to retrace +66% to +100% of prior declines. This pattern has been easily demonstrated in the periods after 1914. However, we’re only trying to illustrate that the acceptance of the Federal Reserve’s role as the leading cause of the current +69% retracement of the prior decline (2007-2009) is false.
Portfolio Turnover: An Important Consideration
“A measure of how frequently assets within a fund are bought and sold by the managers. Portfolio turnover is calculated by taking either the total amount of new securities purchased or the amount of securities sold - whichever is less - over a particular period, divided by the total net asset value (NAV) of the fund. The measurement is usually reported for a 12-month time period.”
2010 Performance Review
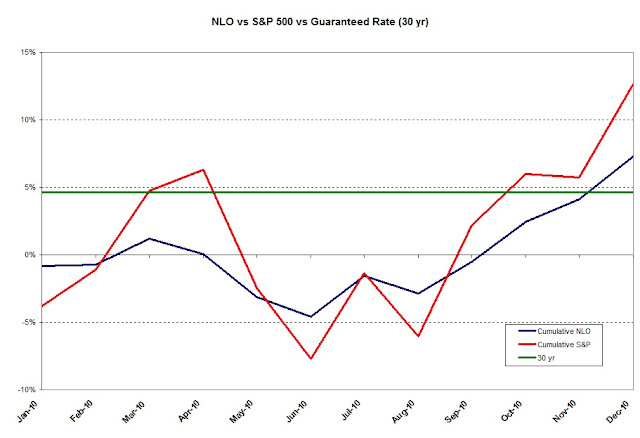 |
| New Low Observer performance for 2010 (http://www.newlowobserver.com/) |
|
Dow
|
S&P
|
NASDAQ
|
NLO
|
|
|
2006
|
16.29%
|
15.74%
|
9.52%
|
18.30%
|
|
2007
|
6.43%
|
5.46%
|
9.81%
|
19.80%
|
|
2008
|
-33.84%
|
-37.22%
|
-40.54%
|
14.35%
|
|
2009
|
18.82%
|
27.11%
|
43.89%
|
36.65%
|
|
2010
|
11.02%
|
14.32%
|
16.91%
|
7.14%
|
NLO Dividend Watch List
We began the year with a very strong market that also included a Dow Theory confirmation of the bullish trend and our watch list now contains 19 companies that are within 15% of their 52-week low.
January 14, 2011 Watch List
| Symbol | Name | Price | % Yr Low | P/E | EPS (ttm) | Dividend | Yield | Payout Ratio |
| ABT | Abbott Laboratories | 46.89 | 5.16% | 15.48 | 3.03 | 1.76 | 3.75% | 58% |
| CL | Colgate-Palmolive Co. | 78.31 | 7.10% | 18.30 | 4.28 | 2.12 | 2.71% | 50% |
| CLX | Clorox Co. | 63.98 | 8.51% | 13.76 | 4.65 | 2.20 | 3.44% | 47% |
| LLY | Eli Lilly & Co. | 34.91 | 9.03% | 8.01 | 4.36 | 1.96 | 5.61% | 45% |
| KMB | Kimberly-Clark Corp. | 63.64 | 9.25% | 14.40 | 4.42 | 2.64 | 4.15% | 60% |
| CAG | ConAgra Foods, Inc. | 23.11 | 9.94% | 15.51 | 1.49 | 0.92 | 3.98% | 62% |
| JNJ | Johnson & Johnson | 62.55 | 10.01% | 12.84 | 4.87 | 2.16 | 3.45% | 44% |
| UVV | Universal Corp. | 39 | 10.29% | 7.66 | 5.09 | 1.92 | 4.92% | 38% |
| NWN | Northwest Natural Gas Co. | 45.71 | 11.35% | 16.33 | 2.80 | 1.74 | 3.81% | 62% |
| CWT | California Water Service | 37.68 | 11.45% | 19.94 | 1.89 | 1.19 | 3.16% | 63% |
| MRK | Merck & Co., Inc | 34.23 | 11.50% | 13.22 | 2.59 | 1.52 | 4.44% | 59% |
| SYY | Sysco Corp. | 30.45 | 12.82% | 15.70 | 1.94 | 1.04 | 3.42% | 54% |
| AWR | American States Water Co. | 35.24 | 12.95% | 23.97 | 1.47 | 1.04 | 2.95% | 71% |
| PEP | PepsiCo Inc. | 66.78 | 13.67% | 16.82 | 3.97 | 1.92 | 2.88% | 48% |
| TGT | Target Corp. | 55.07 | 14.18% | 14.42 | 3.82 | 1.00 | 1.82% | 26% |
| ALL | Allstate Corp. | 30.71 | 14.33% | 14.49 | 2.12 | 0.80 | 2.61% | 38% |
| WMT | Wal-Mart Stores, Inc. | 54.81 | 14.74% | 13.57 | 4.04 | 1.21 | 2.21% | 30% |
| WABC | Westamerica BanCorp. | 55.9 | 14.78% | 17.52 | 3.19 | 1.44 | 2.58% | 45% |
| MCY | Mercury General Corp. | 42.97 | 14.95% | 11.22 | 3.83 | 2.40 | 5.59% | 63% |
| 19 Companies | ||||||||
Some of these companies have been "stuck" on our list for quite some time. Clorox (CLX) has been stuck in the $62 and $64 range for about 10 weeks. For six months Colgate (CL) has spent most of its time trading between $80 and $75. According to Charles Dow, this biding of time by trading in a "line" creates values (article here) and may be the first sign of accumulation by institutional investors. Moreover, if the price remains constant while the underlying fundamentals improve (i.e. earnings, dividend, cash flow, book value etc.), the shares could be deemed screaming buys. Conservative and patience investors may want to start their research on these names.
Insurance names are of particular focus by our team currently. According to Yahoo!Finance, Allstate (ALL) sports a price to book ratio (P/B) of 0.86 while Mercury General (MCY) has a P/B of 1.27. We are actively buying up many insurance company stocks that have exceptionally low price to book ratios on a relative basis.
Northwest Natural Gas (NWN) is again creeping towards its annual cycle of bottoming in February and March. Our October 3, 2009 article (located here) on this topic provides what we believe is extensive reseach on the pattern of cycle bottoms for NWN going as far back as 1970. As a follow-up, another article (located here) that we did on NWN provides technical insights on Edson Gould's Altimeter by comparing the stock price movement between 1995-1997 and 2000-2009. These elements may assist in your fundamental analysis of a great stock with a decent dividend yield.
Top Five Performance Review
| Name | Symbol | 2010 Price | 2011 Price | % change |
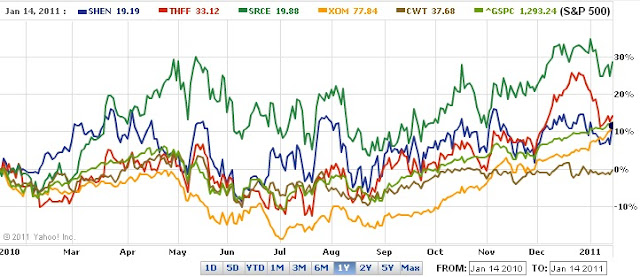
| Shenandoah Telecom. | SHEN | 17.18 | 19.19 | 11.70% |
| First Financial Corp. | THFF | 28.97 | 33.12 | 14.33% |
| 1st Source Corp. | SRCE | 15.14 | 19.88 | 31.31% |
| Exxon Mobil | XOM | 69.11 | 77.84 | 12.63% |
| California Water | CWT | 37.7 | 37.68 | -0.05% |
| Average | 13.98% | |||
| Dow Jones Industrial | DJI | 10,706.99 | 11,787.38 | 10.09% |
| S&P 500 | SPX | 1,147.72 | 1,293.24 | 12.68% |
Disclaimer
Nasdaq 100 Watch List
| Symbol | Name | Price | P/E | EPS | Yield | P/B | % from Low |
| ISRG | Intuitive Surgical | $267.40 | 31.8 | $8.40 | - | 5.26 | 8.68% |
| CEPH | Cephalon, Inc. | $60.32 | 11.3 | $5.35 | - | 1.81 | 9.67% |
| CSCO | Cisco Systems | $20.97 | 15.4 | $1.36 | - | 2.62 | 10.37% |
| APOL | Apollo Group, Inc. | $37.98 | 10.5 | $3.62 | - | 4.30 | 12.54% |
| AMGN | Amgen Inc. | $56.98 | 12.3 | $4.63 | - | 2.24 | 13.37% |
| ERTS | Electronic Arts | $16.05 | - | -$0.48 | - | 2.04 | 14.17% |
| QGEN | Qiagen N.V. | $19.32 | 30.4 | $0.64 | - | 1.89 | 14.59% |
| TEVA | Teva Pharma. | $54.01 | 16.6 | $3.25 | 1.30% | 2.22 | 14.94% |
| VRTX | Vertex Pharma. | $36.16 | - | -$3.73 | - | 11.31 | 15.71% |
| GRMN | Garmin Ltd. | $30.53 | 8.3 | $3.66 | 4.80% | 2.10 | 16.93% |
| INTC | Intel Corporation | $20.66 | 11.2 | $1.85 | 3.00% | 2.43 | 17.39% |
| GILD | Gilead Sciences | $37.50 | 11.0 | $3.42 | - | 5.36 | 18.18% |
| SHLD | Sears Holdings | $70.18 | 41.9 | $1.68 | - | 0.94 | 18.53% |
| ^NDX | Nasdaq 100 | 2,276.70 | |||||
| Symbol | Name | 2010 | 2011 | % change |
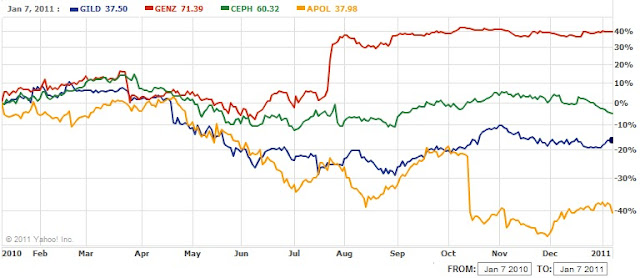
| GILD | Gilead Sciences | 44.54 | 37.50 | -15.81% |
| CEPH | Cephalon, Inc. | 63.01 | 60.32 | -4.27% |
| GENZ | Genzyme Corp | 53.81 | 71.39 | 32.67% |
| APOL | Apollo Group | 60.50 | 37.98 | -37.22% |
| Average | -6.16% | |||
| ^NDX | Nasdaq 100 | 1892.59 | 2276.70 | 20.30% |
NLO Dividend Watch List
Watch List Summary
We end 2010 and begin 2011 with 10 companies on our Dividend Watch List. The table below provides investors with some great prospects for the new year.
December 31, 2010 Watch List
| Symbol | Name | Price | % Yr Low | P/E | EPS (ttm) | Dividend | Yield | Payout Ratio |
| CLX | Clorox Co. | 63.28 | 7.33% | 13.61 | 4.65 | 2.20 | 3.48% | 47% |
| CAG | ConAgra Foods, Inc. | 22.58 | 7.42% | 14.29 | 1.58 | 0.92 | 4.07% | 58% |
| ABT | Abbott Laboratories | 47.91 | 7.45% | 15.81 | 3.03 | 1.76 | 3.67% | 58% |
| KMB | Kimberly-Clark Corp. | 63.04 | 8.22% | 14.26 | 4.42 | 2.64 | 4.19% | 60% |
| JNJ | Johnson & Johnson | 61.85 | 8.78% | 12.70 | 4.87 | 2.16 | 3.49% | 44% |
| SYY | Sysco Corp. | 29.40 | 8.93% | 15.15 | 1.94 | 1.04 | 3.54% | 54% |
| LLY | Eli Lilly & Co. | 35.04 | 9.43% | 8.04 | 4.36 | 1.96 | 5.59% | 45% |
| CL | Colgate-Palmolive Co. | 80.37 | 9.92% | 18.78 | 4.28 | 2.12 | 2.64% | 50% |
| CWT | California Water Service | 37.27 | 10.23% | 19.72 | 1.89 | 1.19 | 3.19% | 63% |
| AWR | American States Water | 34.47 | 10.48% | 23.45 | 1.47 | 1.04 | 3.02% | 71% |
| 10 Companies | ||||||||
Top Five Performance Review
In our ongoing review of the NLO Dividend Watch List, we have taken the top five stocks on our list from January 1, 2010 and have check their performance one year later. The top five companies on that list can be seen in the table below.
| Name | Symbol | 2009 Price | 2010 Price | % change |
| SUPERVALU Inc. | SVU | 12.71 | 9.63 | -24.23% |
| California Water Service | CWT | 36.82 | 37.27 | 1.22% |
| Exxon Mobil Corp. | XOM | 68.19 | 73.12 | 7.23% |
| CR Bard, Inc. | BCR | 77.9 | 91.77 | 17.80% |
| Aqua America Inc | WTR | 17.51 | 22.48 | 28.38% |
| Average | 6.08% | |||
| Dow Jones Industrial | DJI | 10,520.10 | 11,577.51 | 10.05% |
| S&P 500 | SPX | 1,126.48 | 1,257.64 | 11.64% |
Disclaimer

