Category Archives: 1900

1900-2020: Dow in Years Ending in Zero

This from Richard Russell’s Dow Theory Letters dated December 19, 1979:

“Note that all the zero years have started poorly and have been in a state of collapse by their 5th month (May). The single exception since 1900 was the year 1950 (Issue 772. page 2.).”

image

How have the  “zero years” from 1980 to 2020 done?

image

In the period from 1900 to 2020, that average percentage change has been -5.65%.  The average percentage change from 1980 to 2020 has been +0.62%.

image

Not much can be gleaned from this perspective other than the zero years having below average market returns [+8.64% inflation adjusted] 77% of the time.

Chart of the Day: Cigars, Cigarettes, E-Cigs

Below is a chart of the production of cigars and cigarettes from 1900-1923.

image

We have included the market share comparison of Juul, the e-cigarette that Altria (MO) recently increased their stake in, and other tobacco related products from 2014 to 2017 in a research report generated by Bonnie Herzog, senior analyst at Wells Fargo Securities.

image

Are cigarettes going the way of the cigar?  Maybe. Will e-cigarettes replace cigarettes? Possibly.

As far as we’re concerned, all articles on the topic of cigarettes and e-cigs should mirror the 1924 Barron’s article title, “Can the Cigarette Come Back?: A Great Industry in Process of E-volution.”

Real Estate: Nationwide Declines from 1910 to 1936

In a CNBC interview that took place on July 1, 2005, Ben Bernanke said:

“We’ve never had a decline in house prices on a nationwide basis.”

This claim is coming from a scholar who specialized in the Great Depression.  The Great Depression was an era of nationwide house price declines as represented in the red box below.

image

Reviewing the work of Roy Wenzlick, we can see that house price declines were not the only measurable metric that real estate suffered on a nationwide basis.  Throughout the U.S., in more than 70 large cities we see that rents decreased, number of new dwellings decreased, office vacancies increased, farm land values decreased and real estate transfers decreased.   Below data and charts based on the work of Roy Wenzlick demonstrating nationwide trends in real estate. Continue reading

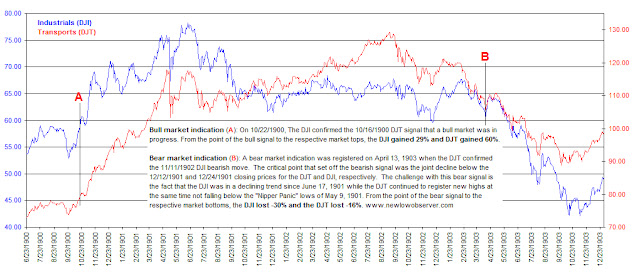
Dow Theory: 1900-1903

The following is the beginning of a series that examines prior bull and bear market indications according to Dow Theory since 1900.  We will include opinions and insights from the leading Dow Theory proponents and commentators from the respective periods, whenever possible.
Industrials (DJI), Transports (DJT)

Text in chart:

Bull market indication (A): On 10/22/1900, the DJI confirmed the 10/16/1900 DJT signal that a bull market was in progress.  From the point of the bull signal to the respective market tops, the DJI gained 29% and the DJT gained 60%.
Bear market indcation (B): A bear market indication was registered on April 13, 1903 when the DJT confirmed the 11/11/1902 DJI bearish move.  The critical point that set off the bearish signal was the joint delcine below the 12/12/1901 and 12/24/1901 closing prices for the DJT and DJI, respectively.  The challenge with this bear signal is the fact that the DJI was in a declining trend since June 17, 1901 while the DJT continued to register new highs at the same time not falling below the "Nipper Panic" lows of May 9, 1901.  From the point of the bear signal to the respective market bottoms, the DJI lost -30% and the DJT lost -16%.