Category Archives: 4 year

The Convergence of Stock Market Forces

In our last posting of Dow Theory we mentioned the need for caution on premature calls of a new bull market.  We pointed out that with the Dow Transports and Dow Industrials so close to their respective all-time highs, investors should wait for confirmation of both indexes before getting too excited.  Now we’d like to introduce another observation of Charles H. Dow’s with regards to stock market cycles which might be the perfect antidote to further movement higher.

In June 2010, we published an article titled “The 4 to 4 1/2 Year Market Cycle” (found here).  In that article, we quoted Dow as saying the following:

Continue reading

4-Year Cycle Update

On June14, 2010, we wrote an article titled “AMarket Cycle Worth Observing.”  Inthat article, we proposed that there was significant validity in the beliefthat the stock market ebbs and flows in a 4 to 4 ½ year cycle.
In aneffort to make our point, we provided examples from Charles H. Dow, co-founderof the Wall Street Journal, and Richard Russell editor of the Dow Theory  Letters (www.dowtheoryletters.com).  The examples were drawn from the late 19thand 20th century.  The purposeof connecting such disparate periods was to show that regardless of the changein times, some attributes of the stock market remain intact.
In ourclosing paragraph on the 4-year cycle we said the following:
“If my observations on thistopic are correct, then we have at least until January 2011 to June 2011 beforethe half cycle is complete. Afterwards, the market would either trade in arange or establish a well-defined bottom in accordance with the 4 to 4 ½ yearmarket cycle.”
Ourarticle of June 14, 2010 came after an -11% decline in the Dow Jones IndustrialAverage.  Subsequent market action led tothe Dow Jones Industrial Average rising +25.71%.  Coincidentally, the Dow Industrials peaked onApril 29, 2011 at 12,810.54 with two failed attempts at reaching new highs inJuly 2011.
Because we’rewithin 9 months of the second half of the 4-year cycle, we believe that thereis approximately another year to go of the stock market continuing to trade ina range or reaching an ultimate low.  
For themarket to trade in a range we expect that the Dow Jones Industrial Average doesnot exceed the high of 12.810.54 by more than 10% while not falling below10,655.30.  If both the Dow Industrialsand Dow Transports exceed their respective highs we would view such action as anew cyclical bull market.  Our downsidetarget for an ultimate low on the Dow Jones Industrial Average is tentativelyset at 8,540.36.
Althoughgiving our prognostication one year in advance (as indicated in an April 2010posting below), we were off by only one month for the last peak in the market. Furthermore, the evidence suggests that the 4-year cycle is still inplay.  We feel that an appropriateinvesting strategy can be constructed around this concept.  If investing in stocks is a must, then we’drecommend considering the relatively undervalued current and former dividendincreasing stocks from our latest dividend list below.
Symbol
Name
Price
P/E
EPS
% Yield
Price/Book
% from Low
Tootsie Roll
23.77
32.82
0.72
1.40
2.03
4.12%
C.R. Bard, Inc.
85.81
22.05
3.89
0.90
3.96
6.14%
Becton, Dickinson
74.24
13.22
5.62
2.50
3.26
6.70%
John Wiley & Sons
44.77
15.7
2.85
1.80
2.66
6.88%
California Water Service
17.83
18.29
0.98
3.40
1.64
7.09%
Owens & Minor
27.8
15.61
1.78
2.90
1.93
7.46%
Clorox Company
67.76
19.54
3.47
3.60
-116.98
8.64%
West Pharmaceutical
38.55
21.28
1.81
1.90
1.85
8.73%
Frisch's Restaurants
20.27
22.93
0.88
3.30
0.8
9.92%

Market Review and Analysis

As the Dow Jones Industrial Average (DIA) approaches the 12,000 level, we believe it is necessary to review our analysis leading up to this point. There have been indications that the market would knock on the door of 12,000. And we’ve been at the forefront of this analysis very early on.
Starting as early as February 12, 2009 (article here), we warned that despite the declining trend in the markets, history has proven that declines of 40% or more tend to retrace 60% to 100% of the previous decline.
In September 2009, after reviewing the Coppock Curve (article here), we pointed out that if the market held up in October 2009 that 12,000 on the Dow would not be an unrealistic price target.
In January 2010, we mistakenly thought that the Dow had a good chance to reach 12,000 by February 2010 (article here). Although we were woefully inaccurate in the timing of our estimate, we were convinced that 12,000 as an upside target was not unreasonable.
On March 23, 2010, we came out with an article that highlighted what we thought was confirmation of a cycle low in the market on February 8th (article here). In retrospect, although it was a major low for the year 2010, it was not as significant as the July 2010 low. However, we reiterated 12,000 as the target for the Dow.
Our eyes are now trained on the next target for the market. This is where our “analysis” is put to the test. All along we’ve thought that a rise from 6,400 to 12,000 would not be very unusual. However, getting back to even, or 14,164, will be very challenging. There are many who feel that external forces have falsified the markets rise.
As far as we’re concerned, we’ve accomplished the target that was long since projected and is now upon us. As we’ve indicated in a recent article, the Dow Industrials’ upward trend has less to do with the actions of the Federal Reserve and more to do with the corrective nature of markets after a significant plunge like in the period from October 2007 to March 2009 (article here).
We’ve noted in the article titled “Diversification Doesn’t Matter” that declines in the Dow will be amplified in the S&P 500 and Nasdaq Composite Index (article here). Exposure to these diversified indexes through the use of index funds and ETFs will result in surprising losses that defy the theory of diversification as was the case in 2008.
We believe that as long as the price of gold keeps moving higher in conjunction with the Philadelphia Gold and Silver Index (XAU) and Dow Theory confirmations of the bullish trend continue, there is a good chance that the market will retrace 100% of the previous decline from 2007 to 2009. At times like these, the rise and fall of the price of gold may be a leading indicator for where the market might be headed. Our numerous articles on the correlation between gold and the stock market have proven to be correct for those willing to accept the data from an unemotional standpoint (article link).
Although it is not unusual for markets to retrace 100% of a prior decline of 40% or more, we’re more than willing to figuratively step aside and watch what happens next. However, we cannot help taking another stab at when, and not at what exact level, the Dow Industrials will peak. Two prior articles on the topic are the basis for our thoughts on the prospects for where the top may occur.
On June 14, 2010, we wrote an article titled, “A Market Cycle Worth Observing” (article here). In that article, we reminded readers of the consistency of 4-year cycles to provide key markers for tops and bottoms in the market. We included referenced from Charles H. Dow’s era, founder of the Wall Street Journal, from 1901 and prior. We gave examples as provide by Richard Russell from 1953 to 1979. We were even able to provide examples from the period between 1987 and 2009.
If there really are 4-year cycles, as we contend, then October 2007 would stand as the marker for the last peak in the cycle. In theory, the mid-point for the peak would be some point in 2009. For us, March 9, 2009 represents the low or mid-point for the 4-year cycle. Our estimate is that the full 4-year cycle should be completed with the Dow Jones Industrial Average peaking at some point in 2011.
According to Dow Theory, the downside target is set at 9,273.50. If this level is breached in conjunction with the Dow Transports, then we could consider a bear market has been initiated.
The second article that we derived our view of the market is dated April 11, 2010 on the topic of Dow Theory (located here). In that market analysis, we proposed, in addition to the fact that the Dow Industrials “…could go to 11,574.59 with no problem,” we outlined three hypothetical scenarios under which the Dow Industrials would reach 14,164.
In retrospect, and upon further analysis, we realized that those projections were really indications for when the market would top irrespective of the exact level that the top would occur. It seems to us that the period from January 31, 2011 to June 18, 2011 is the timeframe for when the completion of the cycle should take place.
Despite our concerns for an eminent top in the market, we will continue to buy and sell individual stocks. From our experience in 2008, gains can be obtained from individual stocks within the context of a declining trend in the market. In fact, during 2008 there were only three months where losses were registered which were June, October and November. Although these months incurred substantial losses, 2008 ended with overall gains of 14% in our portfolio (article link).


Please revisit New Low Observer for edits and revisions to this post. Email us.

The 4 to 4 1/2 Year Market Cycle

When introducing the topic of market cycles it is often looked upon as something that is more wishful thinking more than anything else. However, it is my hope that I can provided sufficient evidence to convince you that objective observation of the 4 to 4 ½ year market cycle is well worth your time.
Introduction of the topic of the 4 to 4 ½ year market cycle does not come lightly. On September 13, 1900, Charles H. Dow, founder and editor of the Wall Street Journal, referenced the 4-year cycle as noted below:
We have frequently demonstrated that the stock market, while full of short fluctuations, has a continuing main movement, which often runs in one direction for three or four years at a time.”
Again on February 21, 1901, Dow makes reference to the 4 to 4 ½ year cycle by saying:
For the past 25 years the commodity market and the stock market have moved almost exactly together. The index number representing many commodities rose from 88 in 1878 to 120 in 1881. It dropped back to 90 in 1885, rose to 95 in 1891, dropped back to 73 in 1896, and recovered to 90 in 1900. Furthermore, index numbers kept in Europe and applied to quite different commodities had almost exactly the same movement in the same time. It is not necessary to say to anyone familiar with the course of the stock market that this has been exactly the course of stocks in the same period.”
All of the period that Dow mentions are based on the 4 year market cycle.  However, you don’t need to have a background in secular bull or bear markets from the 19th century to understand the value and weight of the 4 to 4 ½ year market cycle. In the Richard Russell’s Dow Theory Letter dated July 5, 1979, the 4 to 4 ½ year cycle is mentioned again. Of the cycle in question, Russell said:
We appear to have skipped the surest thing in the market this year, and that is the bottoming of the 4 to 4 ½ year cycle.”
Russell said this even though in retrospect we can clearly see, from a technical standpoint, that 1978 was the actual bottom in the cycle. Only four years later was the ultimate bottom of 1982 that would be the launching pad for the bull market from Dow 1,000 to Dow 10,000. In the same 1979 issue of the Dow Theory Letters, Russell includes a chart that points out the prior cycle bottoms since 1949 (1953, 1957, 1962, 1966, 1970, 1974, 1978) which I’ve included below.
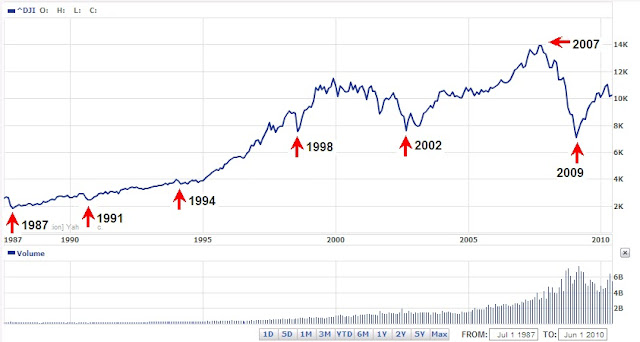
We’ve pointed out that 1982 was the cycle bottom that launched a powerful bull market. However, that bull market wasn’t without interruptions. In the chart below we note the 4 to 4 ½ year cycles that took place along the way (1987, 1991, 1994,1998, and 2002).
Every cycle implies a halfway point that a reversal may take place from. For the 4 to 4 ½ year cycle, this means that the first two years of the cycle are spent going up. No matter whether there is secular bull or secular bear market, the 4 to 4 ½ year market cycle plays itself out for the most part.
Our last major market bottom was March 9, 2009. If my observations on this topic are correct, then we have at least until January 2011 to June 2011 before the half cycle is complete. Afterwards, the market would either trade in a range or establish a well-defined bottom in accordance with the 4 to 4 ½ year market cycle.
Sources: