Category Archives: chip manufacturers

Barron’s: Entegris Inc. is a Buy

In a February 20, 2019 Barron’s article titled “How To Get Two Valuable Chip Stocks In One” it is suggested that Entegris Inc. (ENTG) is worth consideration as an investment for the following reasons:

  • Recent merger with Versum Materials (VSM).
  • mergers allow for greater market share and products.
  • Invests heavily in R&D.
  • Accelerated growth potential.
  • Target price of $43 by Patrick Ho of Stifel.
  • Target price of $39 by Weston Twigg of KeyBanc.
  • Target price of $50 by Barron’s “in next few months”.
  • Prior success with large mergers in the past (ATMI in 2014).

Let’s work backwards to see if we can deconstruct the premise to consider ENTG as an investment opportunity at this time.

The prior success related to the ATMI deal, which was announced on February 4, 2014, seems to have had tepid success initially.  In fact, two years after the deal was announced, ENTG was trading at the exact same price, as seen below.

image

To be fair, in 2014, the U.S. economy was experiencing a slowdown that we have already characterized as a “recession-like” even though not officially recognized as one by the National Bureau of Economic Research.  In spite of this fact, the acquisition of ATMI at the time is either reflective of a pervasive attitude by management that thing are good and that they can afford to venture into the merger and acquisition arena or that a temporary peak in the market has arrived.

The target prices offered by the analysts were reasonable hedges on continuation of upside momentum. Patrick Ho of Stifel seemed to be the most reasonable by essentially suggesting that ENTG would retest the prior high.  The $50 price target “…in next few months…” by Barron’s ventures far beyond what seems reasonable considering the run-up in price of +236% from the 2016 low.

The points about greater market share, R&D, and accelerated growth potential are all reasonable assumptions and should materialize.  However, sizable mergers and acquisitions need some element of time to coalesce before the benefits can be seen.  As it appears to be the case in the 2014 to 2016 period, either the acquisition was at the peak in the market or the need for a digestion period was necessary before the gains, 2016 low to most recent peak, can be recognized by investors.

It is easy to be a critic after the fact on mergers and acquisitions and the rationale behind them.  However, to the credit of Entegris management, they could have had their eyes on VSM for a while after it was spun-off from Air Products (APD) in 2016.  However, at the time of the announced deal for Versum Materials, Entegris was at the highest price relative to VSM, as seen below.

image

In this case, the acquisition of Versum Materials was pure genius as in indicates that management is taking advantage of the opportunity before there is a considerable turn in the market when deal making become much more difficult.

Assuming that the 2014 acquisition of ATMI was ENTG management’s prescient call in a reversal of the market and seizing the opportunity before it slipped away, we could infer that the latest acquisition of Versum Materials (VSM) is going to be followed by a cooling off period for the price action of ENTG.  Additionally, there are indications that ENTG could be bought down the road at highly favorable prices.

In our next posting on Entegris Inc., we will project the ten year price targets for the stock assuming a highly conservative growth rate for a chip stock.

Chip Sector Cycle Says Sell

On December 6, 2012, we said the following of our Nasdaq 100 Watch List:

“We’ve highlighted the chip sector stocks to put emphasis on the fact that, as an industry group, the sector may be at or near a low.”

After a year and a half, the chip sector stocks have achieved all that we had anticipated when we wrote about them in late December 2012.  As seen in the chart below, all of the stocks except Altera (ALTR) achieved gains that beat the Nasdaq Composite growth of +46.22% in the same period.

image

The chip sector does run on a cycle and it is our belief that while this may not be the top it is time to sell the principal in those stocks that have had a decent run.  The profit portion should be allowed to compound until new relative lows are achieved. 

We’ve been fortunate to successfully identify two chip sector cycles lows on March 20, 2010 and December 6, 2012.  As we have in the past, we will notify subscribers of investment opportunities at the next cycle low.  Investors may want to consider rotating into sectors that we’ve identified as worth accumulating using the proceeds from the sell of chip sector stocks.

Nasdaq 100 Watch List: December 6, 2012

Below are the Nasdaq 100 companies that are within 10% of their respective 52-week lows. Stocks that appear on our watch lists are not recommendations to buy. Instead, they are the starting point for doing your research and determining the best company to buy. Ideally, a stock that is purchased from this list is done after a considerable decline in the price and rigorous due diligence.

Symbol Name Price P/E EPS Yield P/B payout ratio % from low
WCRX Warner Chilcott plc 11.31 7.75 1.46 4.3 -4.31 34% 2.53%
BIDU Baidu, Inc. 88.47 20.08 4.42 - 8.33 - 3.23%
VOD Vodafone 25.87 - -0.55 4 1.13 -185% 3.69%
BBBY Bed Bath & Beyond Inc. 57.79 13.43 4.3 - 3.31 - 4.01%
MCHP Microchip Tech 30.22 28.72 1.05 4.7 2.96 134% 4.36%
INTC Intel Corporation 20.1 8.78 2.29 4.5 2.01 39% 4.68%
ALTR Altera Corp. 31.08 17.41 1.79 1.2 3.04 22% 5.24%
MSFT Microsoft Corporation 26.63 14.45 1.85 3.5 3.26 50% 5.72%
CTXS Citrix Systems, Inc. 60.13 32.85 1.83 - 3.69 - 6.31%
NVDA NVIDIA Corporation 11.95 14.92 0.8 2.5 1.58 38% 7.17%
EXPD Expeditors Int'l of WA 36.78 22.97 1.6 1.5 3.76 35% 7.46%
SPLS Staples, Inc. 11.37 - -0.01 3.9 1.23 -4400% 7.85%
FLEX Flextronics Int'l  5.9 8.04 0.73 - 1.61 - 7.86%
KLAC KLA-Tencor Corp. 46.53 11.34 4.11 3.4 2.3 39% 7.87%
ATVI Activision 11.28 14.59 0.78 1.6 1.15 23% 8.23%
AMAT Applied Materials 10.76 125.35 0.09 3.3 1.82 400% 8.34%
DLTR Dollar Tree, Inc. 40.28 16.21 2.49 - 5.99 - 8.66%
APOL Apollo Group Inc. 20.18 5.8 3.48 - 2.47 - 9.86%
^NDX NASDAQ-100 2,649.12 - - - - - 23.16%

Watch List Summary

We’ve highlighted the chip sector stocks to put emphasis on the fact that, as an industry group, the sector may be at or near a low.  The last time we made this observation of the chip sector was on March 20, 2010 based on the closing price of March 19, 2010 (found here).  The average return of the chips stocks on that watch list was +21.95% as compared to the Philadelphia Semiconductor Index (SOX) gain of +17.86% over the following year.  After the first year had passed (March 18, 2011-present), the same semiconductors stocks have average a loss of –8.98% as compared to the SOX index decline of –10.67% (see chart below).

image

Within the first year (March 20,2010-March 18, 2011), all of the stocks on our list except Intel (INTC) managed to achieve gains of over +20% before falling lower.  After the first year had passed (March 18, 2011-present), only MXIM and KLAC were able to achieve gains of +20% while INTC was the only stock to rise above +40%. Depending on the timing of the purchase, we wouldn’t be surprised to see the same performance of the chip related stocks on our current watch list.

Watch List Performance Review

In our ongoing review of the Nasdaq 100 Watch List, we have taken the top five stocks from our list of November 18, 2011 (found here) and have checked their performance one year later. The companies on that list are provided below with the closing prices from November 17, 2011 to November 16, 2012.

Symbol Name 2011 2012 % change
CTRP Ctrip.com 26.67 17.58 -34.08%
BMC BMC 36.26 38.73 6.81%
NTAP NetApp 35.73 30.26 -15.31%
QGEN Qiagen 13.71 17.16 25.16%
CHRW Robinson Worldwide 65.65 59.16 -9.89%
Average -5.46%
^NDX Nasdaq 100 2272.09 2534.16 11.53%

image

As can easily be seen by the table above, after one year the top five stocks severely underperformed the representative Nasdaq 100 index.  However, three of the five stocks gained +10% or more within the first six months.

The disastrous performance of Ctrip.com (CTRP), declining over –50%, was highlighted well in advance in our December 16, 2011 posting (found here). At that time (CTRP at $23.10) we said the following:

“Ctrip.com International (CTRP) is on a pace to replicate the performance from the high in April 2008 to the low of January 2009 which equaled a loss of 72%. A similar decline in CTRP from the high of $50.57 would bring the price down to $14.16. Suffice to say, the stock “only” needs to decline another $8.94 or 38% from the current price of 23.10. This seems very easy considering the high volatility of Chinese stocks. We believe that unless CTRP is summarily dismissed from the Nasdaq 100 index, there may yet be life in this company.

We believe that the Nasdaq 100 committee added CTRP to the index based on the performance of Priceline.com (PCLN). Amazingly, at the current price of $23.10, CTRP sits one penny below the 2nd Dow Theory support level of $23.11. any further deviation below the current price almost ensures that the stock is destined for the $10 range.”

At its lowest point, Ctrip.com fell as low as $12.36 on July 30, 2012.  We feel that our analysis, based on Dow Theory provided appropriate warning on the downside risk.

Another stock that severely underperformed in the last year was NetApp (NTAP).  However, our initial analysis of the company on January 20, 2012 (found here) we said the following:

After a 39% decline in price, NetApp (NTAP) is a prime candidate for a two transaction purchase. The first purchase should take place starting at $30. The second purchase should take place around $23.47. Based on the market capitalization of NTAP may actually be a buyout candidate.

In May 2012, NTAP briefly fell below $30 and then rose +20% by the month of September 2012.  Then on November 2, 2012 (found here), we recommended that investors consider buying NTAP ($27.74).  Since our November 2, 2012 recommendation, NTAP has risen +18.28%.  In all the history of the stock market over a 100-year, 50-year, and 30-year period, gains like these are exceptional on an annual basis and should be considered gifts in a months time.

We ask that you consider selling the principal and allow the gains to run.  Keep in mind that we believe that stock is a buyout candidate.  However, Dow Theory says that the wish should not become father to the the thought (source: Hamilton, William Peter. The Stock Market Barometer. Harper & Brothers, New York. 1922. page 133).

Lam Research Buys Novellus: Consolidation in Semis Continues

The Chip sector continued to get smaller and smaller. The most recent news of consolidation came from the largest etch equipment supplier, Lam Research (LRCX), announcing a $3.3 billion buyout of Novellus System (NVLS) in all-stock deal.

Novellus produces deposition machine and Lam Research manufactures etch equipment. The synergy should be good for both companies as well as the industry. Lam Research will have quick access to Intel (INTC) while Novellus will gain ground with NAND flash producers such as Samsung.

We pointed to the fact that the chip sector is one industry to keep an eye on back in early 2010. Since our recommendation, there has been two major acquisitions, Applied Materials (AMAT) bought Varian Semiconductor and Advantest (ATE) bought Verigy. This latest deal may not be the last but we feel that the industry has consolidated enough that a big takeover such as this may not come around any time soon.

Now that the deal is in place, let's take a look at the most recent investment research reports for the assessed fair value (F/V) of Novellus:

Firm Date F/V % Diff
Credit Suisse 6-Dec $42.00 -5%
S&P 10-Dec $41.00 -8%
Valueline 7-Oct $49.40 11%
Morningstar 11-Nov $29.00 -35%
Buyout Value 15-Dec $44.42

Credit Suisse clearly takes the top spot in predicting the fair value of Novellus stock price. This information could be helpful going forward in assessing which data point one should consider.

The following is a recap of the Novellus fundamental figures on the day it was taken over.

P/E - 9.91
F P/E - 12.90
P/Sales - 1.62
P/Book - 2.42

Reference:
Bloomberg: Lam Research to Buy Novellus Systems for $3.3B
EETimes: Lam to buy Novellus in $3.3B, all-stock deal

Please consider donating to the New Low Observer. Thank you.

From Macro to Micro, Cree Follow Up

We wrote an article titled "It's a Matter of Economics, Cree is Overpriced" back in early June. The purpose of that article was not urging investors to short Cree or the market but to observe what happen to company with overly optimistic expectations. We felt that Cree (CREE) was a perfect case in point. So where are we with CREE?
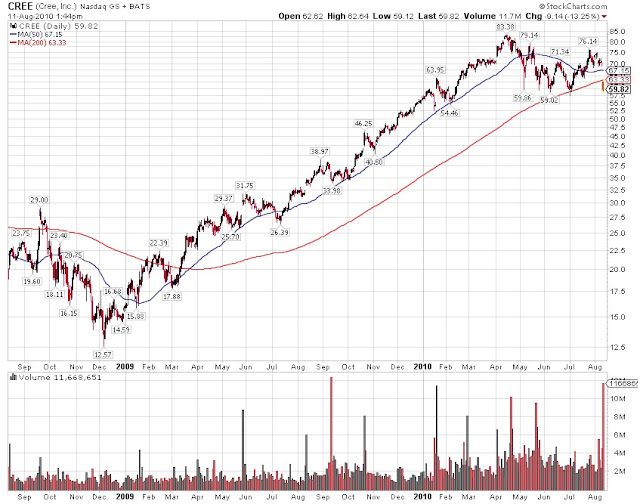
Yesterday Cree reported earnings that exceeded expectations but revenue guidance missed the consensus view. As a result, UBS analyst took the target price down to $64 from $83. The target price of $83 was reached in April and since the stock has been trading in $60 and $75 range.
Fundamental
The data looks good for Cree. Revenue rose 79% year-over-year while earnings per share exploded 348%! Operating margin expanded to 25.9% from 19.7% mentioned in the last article. These are amazing figures but how is it possible that such a great quarter shares could be down more than 10%?  Possible explanation is that all the good news have been discounted into the stock as suggested by Dow Theory.
Another piece of interesting data to support our argument was from the equipment side of the LED market. We mentioned that Kulicke & Soffa (KLIC) had a tremendous amount of booking (equipment orders) from the LED side of the market. Prior to that, they didn't have any business in that segment. Additional data point came another research firm, Displaybank, which claimed that the Blue LED capacity is to double. The equipments mentioned are the Metal-Organic Chemical Vapor Deposition (MOCVD) systems which is the primary method of depositing film onto wafers in the LED making process. The front-end of the market (depositing films) has now confirmed with back-end (assembly).
Technical Picture
The up-trend was established beginning December 2008. As the market (Dow Jones Industrial Average) made a lower-low in March of 2009, Cree held above their December 2008 low pointing to a sustained rally. Through out 2009 and the most of 2010, it held above the 50 days moving average and 200 days moving average. The collapse in price today established an opening price below the 200 days moving average which we use as a long-term trend of the stock.

Summary
Today's fallout of Cree could simply be just another pull back then resume the rally. We're not quite so sure. At this rate, we wouldn't touch it with a 10-foot pole. Once again, we don't encourage shorting. Shares of Cree could easily move back to $80 as it retraces the old high. The purpose is to point out the obvious fact that when things are rosy and analyst are upping their forecasts inflating the P/E, investors should be looking for the exit sign. The macro view of margin contraction and entrance of competition are nature of business which affect the micro view in the long run. The short run of the stock market could be anything but the long run are often determined by value. After the fall of today, Cree trailing P/E will be around 35, much lower than 60 we observed in June. Even if earning exploded, multiple (P/E) contraction will be the key to share price going forward.

Sources:
It's a Matter of Economics, Cree is Overpriced
Report: Blue LED capacity set to double
Cree Swoons On Disappointing Guidance; UBS Cuts Rating
Cree Reports Record Revenue and Net Income for the Fourth Quarter and Fiscal Year 2010

Email our team here.

It’s a Matter of Economics, Cree is Overpriced

A stock that we’ve been watching closely is Cree Incorporated (CREE) which is a U.S. based developer and manufacturer of light emitting diode [LED] products and other types of compound semiconductors. We've been following this stock since the price was in the mid-$40 range and the P/E was in excess of 50.

CREE recently touched a high of $83 and has pulled back to the $70 range. The P/E ratio has expanded to 60 with the expectation that earning will rise 154% in 2010 (from average estimates on 6/3/10 by $0.66 to $1.68) and followed by a rise of 37% that is expected in 2011 (from $1.68 to $2.30). On a forward earnings basis, stock looks reasonably price at 30 times next year earnings. The caveat here is that it is based on next year earnings.

Competitors
Today’s article from The Wall Street Journal titled "LED's Bright Prospects Could Dim", reaffirmed our thinking of what was the hot company / market in 2009 could become the cold one in the not too distant future. Currently, CREE has a healthy operating margin of 19.7% while the industry's margin sits at around 8.22%. The key is question is, will CREE be able to protect its competitor from creeping into its margins? Our answer to that is, it is only a matter of time before competitors start crowding into the market in pursuit of the healthy margins. Some of competitors are Lumileds (Philips), Sharp, Nichia, Toyoda Gosei, Taiwan Semiconductor  (TSM), and many smaller companies in China.

More Clues From Equipment Supplier

The talk of competition is where things get pretty interesting. Seeing the fat margins that are ripe for the picking, Kulicke & Soffa (KLIC) ), a $500 million market cap company that sells assembly equipment seems to be getting in the game. KLIC is one of the largest companies in their market. What's important is KLIC serves as a leading indicator for the chip industry, LED included. KLIC’s most recent earnings report provided great insight into the state of their backlog. Increasing backlog is an important indicator because it typically leads to excess inventory. Increased inventory leads to a possible contraction of profit margins.

Below is the breakdown of the current and historical backlog for KLIC:

  • 2010 - $132,000
  • 2009 - $15,000
  • 2008 - $73,000
  • 2007 - $59,000
  • 2006 - $60,000
  • 2005 - $62,000

If you take the average of the last six years, the backlog is $66,833. Taking the average of 2005 - 2008 (excluding the extremes), we get $63,500. In both cases, the recent surge to $132,000 is extraordinary. This is caused by KLIC trying to rebuild inventory after depleting it during the credit crisis. Adjusting for the extreme situation, our calculations show that the backlog in 2010 is up by 97.5% from the average of the last 6 years and 108% above the average excluding the extremes.

Additionally, Kulike & Soffa isn't your typical LED equipment supplier as noted by the CEO:

The other point I guess I'd make is that in the 2007-2008 peak we had no LED business. So the LED business is all incremental to that.

This tells us that LED makers are going the last mile to make LEDs. Kulicke & Soffa is also expanding their product offerings so we could be completely wrong in that respect. Regardless, the capacity build up is real. Here's another statement from the CEO from the conference call:

When I look at how we've got bonders allocated in the current quarter and into the future, we're seeing a big spike in LED bonders above those levels. So there is a lot of good things happening in terms of stories. And the other thing about the LED again is that that seems more like a secular story than a cyclical story; it should have longer legs to it.

The bullish tone is great for Kulicke & Soffa but doesn't bode well for CREE.

Technical Picture

The chart below is a weekly chart containing P/E ratio and rolling earnings of CREE going back to 1999. The tech bubble in 2000 carried the stock above $100 mark and P/E ratio well above 200.  The stock has been stuck in a trading range of $15 and $30 for most of the decade.

The important part is that earnings haven't improved materially over the intervening period. Current earnings of $1 is still below the 2005 mark but the price has moved well out of proportion to the historical norm. If the stock can get above $105 with good support from earnings, then the stock is off to the race on the upside. Although we can't imagine anymore upside without calling it a bubble based on the chart.

Bottom Line
We think CREE is overpriced and we point it out not as a short selling opportunity but as an observation. CREE has the tone of a growth stock with expanding multiples (P/E) coming to an end. Some of what we have explained above may be more complicated than it needs to be. If so, a simple way to look at it is that CREE trades at more than 60 times its current earnings, very expensive by any standard. They will probably face more competition in the coming years if not months. As a result, profit margins should diminish. This will eventually lead to lower earnings that will likely lead to (all things being equal) a drastic decline in the stock price.

Sources:
LED's Bright Prospects Could Dim
Kulicke & Soffa 2Q10 Press Release
Cree's Competitors
Kulicke & Soffa Industries, Inc. F2Q10 (Qtr End 04/03/10) Earnings Call Transcript

Email our team here.

Chipmaker Intersil Pays Cash for Semi maker Techwell

No sooner than we published our Nasdaq 100 Watch List on Saturday March 20th outlining a preliminary case for chip manufactures than integrated circuit manufacturer Intersil Corporation (ISIL) announces today that it will pay cash for semiconductor manufacturer Techwell (TWLL).  Although it was luck that our suggestion to examine the chip sector came just before the acquisition of Techwell (TWLL), the fact that the purchase was done with cash is a testament to the fact that the chip manufacturers have abundant cash or are under priced and undervalued.  Techwell (TWLL) rose 47.75% during regular trading hours as Intersil (ISIL) will pay a premium of 48.71%. 
For all intents and purposes, the chip sector lite up like a Christmas tree on the announcement of the acquisition of Techwell (TWLL) today.  Our previous Speculative Recommendation of Mattson Technology (MTSN), another wafer equipment manufacturer, is now about to breach the old high of $4.22 if the industry continues to heat up with activity.
We have said it many times before and will continue to iterate the point that when a whole sector or industry starts to appear at or near a new low then it typically indicates that the companies within that industry are undervalued.  It only takes a cursory look to verify if this assumption is correct.  Once it can be verified that companies in a specific industry are undervalued, you can rest assured that the mergers and acquisitions will begin. The fact that cash is being used to buy up companies is the final nail in the coffin on the theory of an undervalued sector.
Since we started the New Low Observer, we have been able to identify the water sector, the biotech/pharma sector and the medical device sector as undervalued before acquisitions or substantial price gains occurred.  It should be noted that we don't have any special skills,  just the willingness to carefully observe and sometimes buy companies that have fallen to a new low.  Get the research going for the companies that are part of the chip sector, and never chase a stock that has a rising price.
-Touc
Email our team here.