Category Archives: CRR

Transaction Alert

We executed the following transaction(s):

Quick Take: Carbo Ceramics

Review

On August 6, 2012, we purchased Carbo Ceramics with the following rationale:

“Carbo Ceramics (CRR) has been mentioned by us on several occasions.  CRR first appeared on our February 10, 2012 U.S. Dividend Watch List (found here) and was trading at $85.94.  An Altimeter was run on CRR which indicated that the stock would be undervalued at $62.40 (found here).  However, as CRR has experienced a dividend increase of 12.5% since our May 28, 2012 Altimeter, the stock is now considered undervalued at $70.  While we do expect approximately 20% downside risk from the current price, we are comfortable with adding to our position when such a decline takes place.”

As it appeared that Carbo was undervalued between $62.40 and $70, we used 5% of our portfolio to purchase the stock. After August 6, 2012, Carbo Ceramics fell as low as $63.03 and increased as much as $156.

image

Update

Below are the updated numbers for Carbo Ceramics after the decline from the most recent peak of $156.  We will cover both aspects of CRR based on Gould’s Altimeter and Speed Resistance Lines.  First, the qualitative review based on the Altimeter.

Review: Carbo Ceramics Meets Upside Target

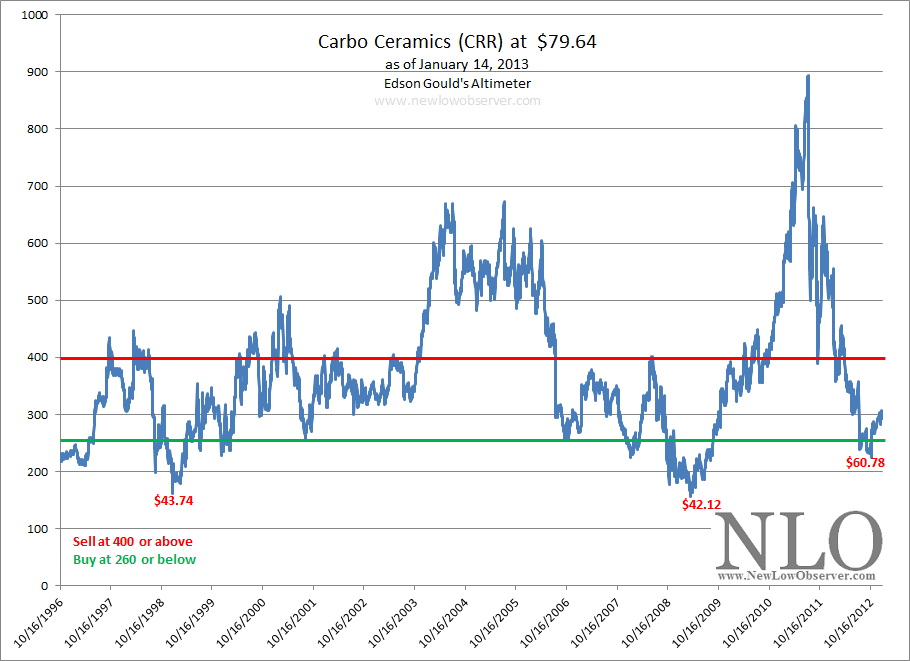
On January 14, 2013, we did a technical review of Carbo Ceramics (CRR) when it was selling at $79.64 (found here).  At the time, we gave our assessment of the downside risk for Carbo Ceramics with the following comments:

“Carbo Ceramics would have to fall to $70.20 in order to be considered a buy using the Altimeter above.  However, as has been the case in the past, seldom does the Altimeter decline to the buy level and then immediately reverse to the upside.  therefore we’d expect a push below the $70.20 level for good measure.  Edson Gould’s Speed Resistance Lines have $65 as the downside support level.”

On July 1, 2013, Carbo Ceramics (CRR) had a closing price of $65.41.  This was within 1% of the expected downside target.  However, on June 24, 2013, CRR fell as low as $62.11 on an intra-day basis and closed at $65.99.  The intra-day low of $62.11 was fairly close to the Dow Theory downside target of $61.34, within 2% of the estimated target.

Finally, we offered up our take on the upside prospects with the following commentary from our January 14, 2013 posting:

“According to Value Line Investment Survey, the fair value for CRR is 14 times 2012 cash flow of $6.50, or a stock price of $91, a gain of +14% above the current price of $79.64. As an alternative, if the estimates by Value Line are correct, the 2013 fair value figure is $100.10, a potential gain of +25.69%.”

On September 16, 2013, Carbo Ceramics (CRR) achieved a price of $101 per share.  This meets the fair value target set by Value Line Investment Survey and hits the resistance level of the ascending $86.59 line on Edson Gould’s Speed Resistance Lines [SRL].

image

It would be luck if Carbo Ceramics manages to exceed the current fair value level by a substantial margin.  We see a move to $109 as the next upside target.  However, keep in mind that when purchasing a stock well below fair value, the only expectation is that the stock may only go to fair value and should decline shortly thereafter.  Our tentative upside target is $109.00 and our downside target is $68.00, as noted in the SRL above.

We will continue to hold our risk-free shares of CRR as they were acquired substantially below the current price as part of our long-term compounding/diversification strategy.

Transaction Alert

Continue reading

Carbo Ceramics Explodes to the Upside

On January 14, 2013, we posted a technical review on Carbo Ceramics (CRR) when the stock was trading at $79.64 (found here).  A careful reading of our rationale for why we thought a rise in CRR was coming is worthwhile.  At the time we said the following:

Continue reading

Technical Review: Carbo Ceramics (CRR)

Carbo Ceramics (CRR) was one of the companies that appeared at the top of our dividend watch list for many weeks beginning in February 2012. The watch list served as a beginning point for our research and we took a position in August (found here) at $65.02 (green arrow on chart below). Within three months, we saw shares of CRR rally to $74, a +13.8% gain. As such, we ‘hedged’ our position by selling the principal (found here) and let the profit run (red arrow on chart below).

Recent activity in Carbo Ceramics price suggests that, on a technical basis, the decline is over. Though a rally to its intraday peak of $180 is not expected, we believed there is a good opportunity for those interested in a short to medium-term speculative position in the stock.

image

In our view, the biggest bull case, on a technical basis, is that the 50-day moving average has crossed above the 150-day moving average creating what some call a "golden cross." We rely on the 150-day versus the more popular 200-day moving average for the fact that it is the road less traveled and provides an indication ahead of the crowd.

Currently, shares of Carbo Ceramics are trading just above the 50-day moving average, making this an ideal short-term transaction. For those who wish to trade this generally significant technical pattern, we’d consider selling if shares close below the 150-day moving average or if the stock gains +10% or more.

From a fundamental standpoint, Carbo Ceramics (CRR) provides long-term holders of the stock with the following attributes:

  • According to Value Line Investment Survey, the fair value for CRR is 14 times 2012 cash flow of $6.50, or a stock price of $91, a gain of +14% above the current price of $79.64. As an alternative, if the estimates by Value Line are correct, the 2013 fair value figure is $100.10, a potential gain of +25.69%.
  • Value Line indicates that Carbo Ceramics has increased the dividend for 12 consecutive years in a row.
  • Carbo Ceramics book value has had an annualized growth rate of +14.73%.
  • Carbo Ceramics has no debt

What Is the Downside Risk If I Want to Hold CRR for the Long-Term?

Dow Theory has the following downside targets for Carbo Ceramics:

  • $61.34
  • $44.39
  • $27.43

Based on the work of Edson Gould, Carbo Ceramics has the following Altimeter:

CRR 1-14-2013

Carbo Ceramics would have to fall to $70.20 in order to be considered a buy using the Altimeter above. However, as has been the case in the past, seldom does the Altimeter decline to the buy level and then immediately reverse to the upside. therefore we’d expect a push below the $70.20 level for good measure.

image

Edson Gould’s Speed Resistance Lines have $65 as the downside support level.

The most conservative of the three downside targets mentioned above is the Dow Theory level of $61. This seems be the most appropriate level to consider a first, or second, purchase if the desire is to hold Carbo Ceramics for the long-term.

Transaction Alert: Sold CRR at the Market

Today we sold the principal portion in shares of Carbo Ceramics (CRR).

  • On August 6, 2012, we posted a transaction alert indicating that we bought Carbo Ceramics (CRR) at the market (found here). The gain has been +17%. The annualized rate of return is nearly 92%.

We continue to hold shares of the company (profit portion) allowing us to slowly build a well diversified portfolio and continue to see capital appreciation and compounding of the income.

Carbo Ceramics is Worth Considering Now

At the time that Carbo Ceramics (CRR) was trading at $82.79,  we said the following in our May 28, 2012 article (found here):

“Based on the current dividend for Carbo Ceramics, we have anticipated that the stock price will decline to $62.40 before the next buy indication is triggered.”

Interestingly, Carbo Ceramics fell as low as $62.41 on a closing basis on October 10, 2012.  Although this is one penny above the prior $62.40 buy indication, the recent increase of the dividend from $0.24 to $0.27 put the stock well within the buy range, as shown below.  Our estimate of $62.40 was based on Edson Gould’s Altimeter which has given reasonable buy and sell recommendations in the past.

image

As indicated in the chart, there are points where Carbo Ceramics has fallen well below the normal buy range.  On two prior occasions, Carbo Ceramics fell as low as the equivalent of today’s $43.74 and $42.12.  We are not putting it past this company to accomplish a similar decline this time around.  However, this is why we recommend the purchase of this stock in two phases.

image

When Edson Gould’s Speed Resistance Lines [SRL] are applied to Carbo Ceramics we can see that the stock has taken back a majority of the gains that have accrued from the 2008 low to the most recent peak.   The SRL indicates that the extreme downside target of $60.08 is about to be reached shortly.  However, there does exist the possibility of going back to point where CRR established its critical support at $26.51.

According to Dow Theory, Carbo Ceramics has the following downside targets:

  • $60.29
  • $43.40
  • $26.51

As indicated in our portfolio (found here), we have already completed the first of the two purchases for CRR and are waiting for either the price to rise to the sell range or decline to the $43.74 level before implementing the next purchase.  The sell range currently stands at $96.

Note: This stock is worth considering only with the appropriate amount of due diligence by confirming the fundamental attributes and proper consideration of the downside risk as indicated above.

Carbo Ceramics Altimeter

Below is the Altimeter for Carbo Ceramics (CRR) which is ranked number 7 on our May 25, 2012 U.S. Dividend Watch List (found here).  Using Edson Gould’s Altimeter, we have arrived at the conclusion that Carbo Ceramics (CRR) should be bought (green line) any time the Altimeter declines to 260 and below and should be sold (red line) whenever the Altimeter rises to 400 and above.

image

Below is a table which outlines the actual price and date when Carbo Ceramics’ Altimeter rises or falls to the indicated levels.

Date Altimeter level stock price buy/sell % change
6/13/1997 257.40 12.87 buy 59%
10/2/1997 410.80 20.54 sell -41%
8/27/1998 239.00 11.95 buy 67%
4/24/2000 399.60 19.98 sell -22%
8/20/2001 258.33 15.50 buy 56%
1/3/2002 403.00 24.20 sell 27%
10/3/2006 256.16 30.74 buy 82%
6/23/2008 401.50 56.21 sell -21%
10/6/2008 258.35 43.92 buy 65%
4/15/2010 403.55 72.64 sell ????????
???????? 260.00 62.40 buy  

Based on the current dividend for Carbo Ceramics, we have anticipated that the stock price will decline to $62.40 before the next buy indication is triggered.  However, as we’ll describe below, there are some careful considerations of what you give up when deciding to buy Carbo Ceramics based on Edson Gould’s Altimeter.

First, it is important to note that in all except one instance, January 3, 2002, Carbo Ceramics had reasonable gains when a buy indication was triggered and avoided losses when the sell indication was triggered.

As an example, if you bought in October 6, 2008 and sold on April 15, 2010 (at crosshair below), you only gained 65% and you would have missed the additional 143% rise in the stock’s price, as seen in the following chart:

image

Likewise, the June 23, 2008 sell signal at $56.21 didn’t account for the –53% decline that occurred afterwards.  Instead,  Carbo Ceramics declined -21% from the $56.21 level by the time the next buy signal was indicated on October 6, 2008 (at crosshairs below).

image

So what does all this mean, “buy at the 160 level” and “sell at the 400 level” in the Altimeter?  For the New Low Team, it means that if we can gain an average of +60% in 1-1/2 years with each buy and sell cycle then we will do quite well if we can avoid all of the huge losses, at the expense of missing the huge gains.

Who is Edson Gould?

“Edson Gould spent over 60 years working in and studying financial markets. Gould studied the arts at Princeton, engineering at Lehigh (from where he graduated in 1922), and finance at New York University. In 1922, after working for a short time at Western Electric, he joined Moody’s Investor Service as an analyst and later was editor of Moody’s Stock Survey, Bond Survey, and Advisory Reports. In 1948, he began at Arthur Wiesenberger & Company, where he developed and edited the well-known Wiesenberger Investment Report and became a senior partner. He also was Research Director at E. B. Smith (which later became Smith Barney), and worked for Nuveen.”

(source: Market Technicians Association. Gould, Edson Beers, Knowledge Base. Accessed April 26, 2012. link MTA reference.)

“Market technician Edson Gould always laughed at the idea of having a significant influence on the stock market, but his predictions were the most precise around. He pinpointed major bull markets and prophesied bottom-out markets as if he had his own peephole into the future. But in place of a crystal ball and wacky off-the-cuff schemes, his were smart, intensely researched and time-tested theories that made him a legend in the investment community.”

(source: Fisher, Kenneth L.. 100 Minds That Made the Market. Business Classics, Woodside, CA. 1993. page 320.)