
The worst performing stock from our September 24th list was Colgate (CL). After falling 4% in two weeks, this name is becoming interesting at the current dividend yield. Colgate is in the undervalued range, according to Investment Quality Trends (http://www.iqtrends.com/).
Top Five Performance Review
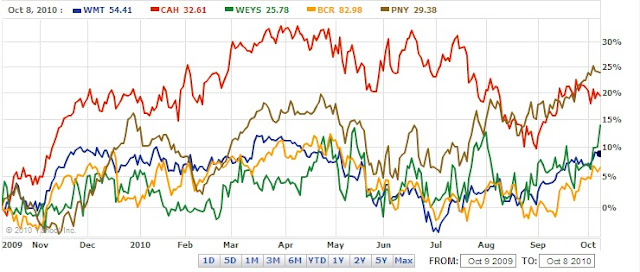
In our ongoing review of the NLO Dividend Watch List, we have taken the top five stocks on our list from October 9, 2009 and have check their performance one year later. The top five companies on that list were Wal-Mart (WMT), Cardinal Health (CAH), Weyco Group (WEYS), Bard Corp. (BCR), and Piedmont Natural Gas (PNY).
As a group, the top five companies on our Dividend List averaged a gain of 14.47% in the last year. This compares with the Dow Jones Industrial Average gain of 11.57% in the same one year time frame. The top performing stock of the group was Piedmont Natural Gas (PNY) which closes out the year with a gain of 23.81%. The worst performing stock was Bard Corp. (BCR) with a paltry gain of 6.47% in the one year time period. The graph below demonstrates that all stocks achieved 10% gains within six months of reaching a new low.
 |
| Chart courtesy of Yahoo!Finance and Commodity Systems Inc (CSI) |
| Symbol | Name | Price | % Yr Low | P/E | EPS (ttm) | Div/Shr | Yield | Payout Ratio |
| CL | Colgate-Palmolive Co. | 74.90 | 2.43% | 17.88 | 4.19 | 2.12 | 2.83% | 51% |
| CAG | ConAgra Foods, Inc. | 21.87 | 6.42% | 13.84 | 1.58 | 0.92 | 4.21% | 58% |
| NTRS | Northern Trust Corp. | 48.35 | 6.73% | 15.85 | 3.05 | 1.12 | 2.32% | 37% |
| WST | West Pharmaceutical | 35.11 | 7.24% | 15.33 | 2.29 | 0.64 | 1.82% | 28% |
| BBT | BB&T Corp. | 23.58 | 8.56% | 22.25 | 1.06 | 0.60 | 2.54% | 57% |
| MDT | Medtronic | 33.45 | 8.60% | 10.59 | 3.16 | 0.90 | 2.69% | 28% |
| BEC | Beckman Coulter | 47.95 | 9.10% | 22.83 | 2.10 | 0.72 | 1.50% | 34% |
| SBSI | Southside Bancshares | 18.98 | 9.14% | 7.19 | 2.64 | 0.68 | 3.58% | 26% |
| USB | U.S. BanCorp. | 22.31 | 9.15% | 16.05 | 1.39 | 0.20 | 0.90% | 14% |
| WFSL | Washington Federal | 15.27 | 9.31% | 14.54 | 1.05 | 0.20 | 1.31% | 19% |
| FUL | HB Fuller Company | 20.31 | 9.96% | 13.72 | 1.48 | 0.28 | 1.38% | 19% |
| HCC | HCC Insurance Holdings | 26.24 | 10.02% | 9.02 | 2.91 | 0.58 | 2.21% | 20% |
| TR | Tootsie Roll Industries | 25.53 | 10.04% | 28.05 | 0.91 | 0.32 | 1.25% | 35% |
| HGIC | Harleysville Group Inc. | 33.08 | 10.08% | 12.48 | 2.65 | 1.44 | 4.35% | 54% |
| FFIN | First Financial Bankshares | 47.99 | 10.20% | 18.39 | 2.61 | 1.36 | 2.83% | 52% |
| MLM | Martin Marietta Materials | 78.96 | 10.43% | 43.87 | 1.80 | 1.60 | 2.03% | 89% |
| OMI | Owens & Minor | 28.21 | 10.54% | 14.32 | 1.97 | 0.71 | 2.52% | 36% |
| CBSH | Commerce Bancshares | 38.13 | 10.63% | 15.50 | 2.46 | 0.94 | 2.47% | 38% |
| BOH | Bank of Hawaii Corp. | 45.30 | 10.87% | 12.41 | 3.65 | 1.80 | 3.97% | 49% |
| INTC | Intel | 19.52 | 10.91% | 11.69 | 1.67 | 0.63 | 3.23% | 38% |
| 20 Companies | ||||||||