Category Archives: dividends

The Time Has Come For California Water Services (CWT)

CaliforniaWater Services Group (CWT) has finally arrived at the point that we’veanticipated for the last 2 years.  OnJanuary 3, 2010, we submitted an investment observation that CWT would continueto trade in an established 6-year range that had been identified for at least4 other periods.  Just as a debrief, inthe 2010 piece (found here), we said the following periods traded in 6-year ranges afterbreaking out of the previous range:

  • 1976to 1982

  • 1985to 1993

  • 1993to 1997

  • 1997to 2004

  • 2005to 2011

In a January 1,2011 piece (found here), we reiterated our view on CWT by saying the following:
“…based oncycle analysis, the prospects of CWT making a substantial move above the priorhigh would be between 2011 and 2012.”
As we enter2012, we’re of the view that this is the year that California Water ServicesGroup will break above the 2006 and 2009 highs of $23.  Those interested in buying this stock shouldacquire large quantities and be prepared for the downside risk.  We are reiterating our downside targets at:
  • $17.28
  • $13.70
  • $10.52
Finally, a boilerplatedisclaimer that should be considered for any water utility stock.  Although water is critical to life, stock investorsneed to understand that companies in the water industry aren't a "surething." The biggest reason for this is that when and if water becomes “scarce,”government regulators will step in to take over (nationalize) what shouldotherwise be sold at the most profitable price (thereby curbing wastefulconsumption.) There is literally an upside cap on profitability to a companylike this due to the critical importance of the resource being sold.
Additionally,CWT should be considered a relatively risky stock because of its low dailytrading volume. With a 3-month average volume of 220,000 shares, this stock maynot be suitable for investors who are concerned about getting the "best" price.  However, collecting the current dividend yield of 3.40% should provide some consolation for the wait to rise above $23 in 2012.

The Coming Precious Metals Dividend War

On September 9, 2009 we wrote an article titled “Silver Should be the Focus.” In that article, we cautioned readers to “be mindful of the coming competitive dividend war between precious metal companies. I remember one, now defunct, gold company that paid out their dividend in actual gold. These are all gimmicks to lure investors in at a time when the rule of the day should be ‘head to the exits.’
The first salvos of the coming war to attract investors to precious metal stocks have be initiated.In April 2011, Newmont Mining (NEM) started what they deemed … the industry's first and only dividend policy linked directly to the realized gold price…"Naturally, this isn’t the first time that gold linked dividends has taken place, but it sells really well to those unfamiliar with gold stocks and their dividend policies.On September 19, 2011, Newmont Mining (NEM) announced a further enhancement of their “first ever” gold linked dividend policy with the following changes:


The enhanced policy will continue to link the quarterly dividend rate to changes in the gold price but will also provide an additional step up of 7.5 cents per share when the Company's realized gold price for a quarter exceeds $1,700 per ounce and a further step up of 2.5 cents per share (10 cents in total compared to the existing policy) when the Company's realized gold price for a quarter exceeds $2,000. At average realized gold prices below $1,700 per ounce, the current dividend policy remains unchanged. Newmont's quarterly gold price-linked dividend payments are based on the Company's average realized gold price for the preceding quarter.”
Not to be outdone, Hecla Mining (HL) announced on September 20, 2011 that they would have a dividend that is linked to the price of silver.Hecla’s silver-linked dividend policy is as follows:


The initial quarterly dividend under the policy is expected to be $0.03 per share of common stock ($0.12 per year), if Hecla's average realized silver price for the third quarter is $40.00 per ounce. All dividends, including those in the third quarter, would increase or decrease by $0.01 per share ($0.04 annually) for each $5.00 per ounce incremental increase or decrease in the average realized silver price in the preceding quarter.”
Newmont Mining (NEM) and Hecla Mining (HL) are soon to be joined by a crowded field of precious metal companies that are going to progressively up the ante.It will soon be indistinguishable as to who has the most sensible dividend policy and who has a compounding “money” losing machine.The race to offer attractive dividend payments has help from an unexpected source.
Unlike past precious metal bull markets, gold and silver stocks have stiff competition for investment capital in the form of gold and silver ETFs.In fact, more money is being plowed into the combined gold and silver ETFs than the stocks that have actual claims on getting the metal out of the ground.This presents a challenge for precious metal stocks that would normally issue shares in acquisition of other gold companies or expand their operations.In order to get the share price up, a competitive environment of dividend increases will lead many companies to ruin in an effort to attract new investors.
As described in our 2009 recommendation silver, one gold or silver company is going to “jump the shark” and make their dividend payments in the actual metal.When that time comes, it will be fair warning to protect your positions, though this may be indistinguishable to ebullient gold bugs at the time.
The single best dividend policy that we’ve seen among gold stocks, was held by Homestake Mining [HM] as describe in our October 31, 2010 profile of Homestake (found here).By 1933, Homestake had a 53-year history of continuous dividend payments.Not surprisingly, Homestake was among the 2% of gold stocks that rose in value from 1924 to 1932 due, in part, to their amazing dividend policy.
Because we’re in the early stages of a gold bull market, there is little attention being paid to the quality of the dividend policy.Gold and silver linked dividend policies appear advantageous when the price of the commodity is going up.However, such a policy can imperil a poorly managed company as the average price declines.
The most effective antidote to becoming collateral damage in the coming dividend war will be to buy the gold and silver stocks that are members of the Philadelphia Gold and Silver Stock Index or the Amex Gold Bug Index.Ironically, institutional support, by being the member of an index, will allow gold and silver stocks to survive hard times where others will unnecessarily falter.
Please consider subscribing to the New Low Observer. Thank you.

The Myth of “Inflation Proof” Stocks

As the U.S. experiences record low interest rates, it becomes seemingly obvious that inevitably the next major move is up. What isn’t so obvious is what the impact would be on stocks. Some analysts can definitely see the forest from the trees on this matter. However, having this skill doesn’t automatically mean that navigating that forest is all that easy.
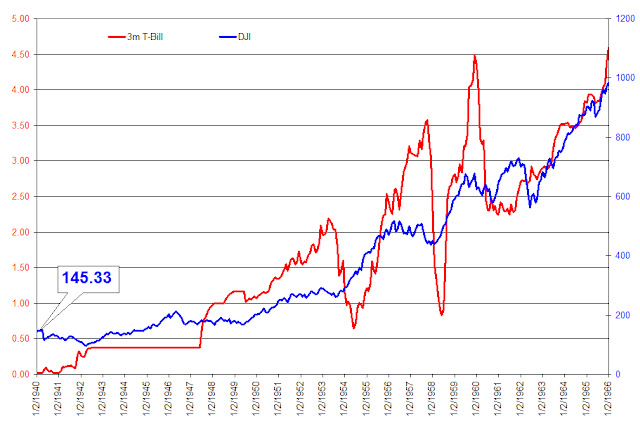
There are two important issues that must be brought to your attention about the forest and the trees in our current investing environment. The first matter (regarding the forest) about rising interest rates is that the bull market in stocks from 1940 to 1966 occurred while rates on 3-month T-bills went from 0.01% in January 1940 to 4.59% in January 1966. The chart below does a side-by-side comparison of rising rates and the Dow Jones Industrial Average. We’re certain that the pervasive thinking is that “this time is different.” However, we wouldn’t want this important fact to remain ignored or glossed over.

The second point (regarding the trees) is that even though inflation is most often represented in the rise of commodity prices, the best investment opportunities may not be in commodity related stocks. To demonstrate this point, we have selected six stocks to compare during a popularly known period of high inflation.

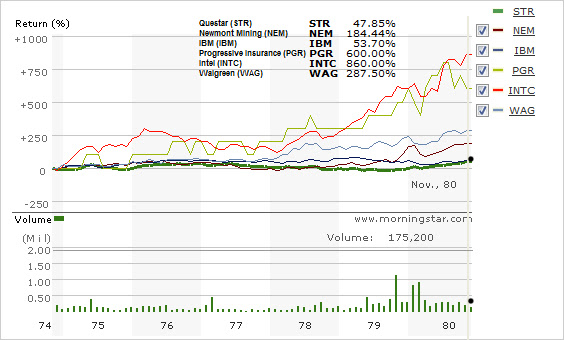
The stocks that we have selected for this comparison are Questar (STR), Newmont Mining (NEM), IBM (IBM), Progressive Insurance (PGR), Intel (INTC), and Walgreen’s (WAG). Two of the stocks are synonymously known as inflation hedges, Questar in the natural gas industry and Newmont Mining in the gold mining industry. The remaining four stocks are a cross-section of almost any economy with insurance, retail, microprocessors and computers being represented.

Unfortunately, our bias towards non-traditional inflation hedges is easily shown when we selected the period from November 1974 to November 1980. However, we wanted to show the performance of stocks, in general, at their lowest point so that there is little confusion about the outcome.

The chart below depicts the total return of all six stocks over the given period in time. Not surprisingly, the stocks most associated with being the best inflation hedge turned out to be among the worst performing. The best performing stock was Intel (INTC) with a gain of 860%. Not far behind Intel was Progressive Insurance (PRG) with a gain of 600%. Walgreen’s came in third with a gain of 287.5% followed by Newmont Mining (NEM) at 184.44% and IBM with 53.7%. Last among the stocks was Questar (STR) with a gain of 47.85%.

While some could rightfully contend that our approach is biased and our conclusions are flawed, we highly recommend that anyone who does their homework and compares the performance of almost any stock with a history of consecutive annual dividend increases to any commodity stock that existed back in the 1970 to 1980 period (on a total return basis), then you’ll be able to arrive at the same conclusions that we did in distinguishing the forest from the trees.

By the way, IBM does not have a long term history of consecutive annual dividend increases which might explain why it couldn’t keep pace in the 1970s.

Please revisit New Low Observer for edits and revisions to this post. Email us.

When, Not If, Dividends Matter

In a note on Barry Ritholtz’s The Big Picture there is an article dated October 3, 2010 that asks the age old question, “Do Dividends Matter?” The author of the article compares the performance of dividend paying stocks against non-dividend paying stocks that are constituents of the S&P 500. After selecting a period of time from December 31, 2009 to September 29, 2010, the author breaks down the analysis by separating the performance of the stocks into three distinct periods; 12/31/2009 to 9/29/10, 4/23/2010 to 9/29/2010 and 12/31/2009 to 4/23/2010.
The conclusion of the article is that whether a company pays a dividend isn’t as important as people think. However, the conclusion comes as no surprise since the period in question is less than a year and the goal was to determine the impact dividends play in the performance of a stock’s price. All measures within a year cannot reveal the same amount of impact of dividends over several decades. In a strange twist, the article proves exactly what the New Low Observer has been saying all along.
First, market performance is often measured in a year or less. As market observers, we don’t control this characteristic, we only make certain that our investment strategy reflects and caters to this fact. This “research” on Ritholtz’s site doesn’t hold up since it doesn’t even span a decade of continuous examination. An individual would do better to accept the mountains of buy-and-hold evidence; which indicates that dividends contribute more than half the total return when measured over a span of 40 years or more. Just be sure that you’ve got a 40-year investment time horizon before you act on such factual data.
Second, the performance of the dividend paying stocks in Tier 1, Tier 2 and Tier 3 over the December 31, 2009 to April 23, 2010 period, beat the non-dividend paying stocks resoundingly. Tier 3, the lowest performing of the dividend paying stocks, outperformed the non-dividend paying stocks by 2% over the given timeframe. As regular readers of our site know, we seek mediocre returns of 9%-12% from each investment. This means that we would have sold somewhere short of 20% and then moved on to the next stock. The worst performing group, Tier 5 of the dividend paying stocks, was only able to achieve 7.57% in the 4-month period. However, if Tier 5 stocks were bought and sold in the time selected, the annualized return would have been 24.41%.
Finally, low dividend yielding stocks easily outperform high yielding stocks. In the survey, Tier 1 had the lowest yielding stocks while Tier 5 had the highest yielding stocks. Tier 1, Tier 2 and Tier 3 of the dividend paying stocks in the “study” easily outperformed the market and the non-dividend paying stocks. Our article titled “Low Yielding Stocks Offer Exceptional Gains” outlined the importance of quality of dividends rather than dividend yield. We were specific in pointing out that what is lacking in yield is typically made up for in appreciation of the stock price. This is very important because most people who have been burned in their investments typically seek out alternatives that might seem to help make up for substantial losses. Unfortunately, this is the time when the markets are about to turn around and the high yielding stocks underperform on the upswing.
Again, we don’t attempt to explain why information on the markets comes in two incongruent varieties, focused in the short-term data with an inappropriate strategy or focused on long-term data that is incompatible with real world investment time frames. We only observe that, within any one-year time span a stock reaches a new low. If narrowed down to the number of companies that have a proven track record of dividend increases or are part of an index that most mutual funds are required to buy, then the odds are in your favor to obtain reasonable gains that exceed the historical market returns. This (il)logical thinking only works if you’re willing to sell in the same time frame that your analysis takes place. These factors are frequently left out of the “research” of whether dividend matter or not.

International Dividend High Fliers

Below are the top ten current and former international dividend high fliers (ranked by dividend yield) that trade as ADRs on the New York Stock Exchange. These are companies that have had a history of dividend increases over the last several years in a row. While this list contains the top ten companies, the full list of 40 companies within 20% of the 52-week low can be found here.
Symbol Name Price P/E EPS Yield P/B % from Low
CRH CRH PLC $19.17 16.98 1.13 5.50% 1.1 1.29%
CWCO Consolidated Water $9.68 21.37 0.45 3.00% 1.14 1.79%
SNY Sanofi-Aventis SA $28.64 9.65 2.97 3.80% 1.13 2.25%
ALTE Alterra Capital Holdings Ltd $17.65 4.79 3.68 2.60% 0.73 2.26%
UL Unilever PLC $26.66 15.37 1.73 4.10% 4.77 3.57%
DEG Etablissements Delhaize Freres $66.30 10.05 6.6 2.00% 1.22 3.74%
UN Unilever NV $27.02 15.58 1.73 4.00% 4.82 3.84%
PRE PartnerRe Ltd. $72.55 4.75 15.28 2.70% 0.78 4.95%
TEVA Teva Pharmaceutical Industries $49.97 17.75 2.82 1.30% 2.35 6.34%
ESLT Elbit Systems Ltd. $52.10 0 0 0 0 7.42%
STO Statoil ASA $19.84 13.35 1.49 3.90% 1.92 7.59%
SYT Syngenta AG $46.84 17.94 2.61 2.00% 3.25 9.11%
RNR RenaissanceRe Holdings $55.86 4.02 13.9 1.80% 0.98 10.70%
AXS Axis Capital Holdings $30.40 8.77 3.47 2.80% 0.73 11.68%
KYO Kyocera Corp $87.80 19.5 4.5 N/A 1.05 13.07%
ACE Ace Limited $53.42 6.3 8.48 2.50% 0.84 13.44%
ASR Grupo Aeroportuario del Sureste $44.89 15.52 2.89 4.10% 1.2 13.70%
TMX Telefonos de Mexico $14.83 9.51 1.56 5.10% 4.09 14.08%
SU Suncor Energy Inc $31.59 19.51 1.62 1.20% 1.49 14.25%
PBR Petroleo Brasileiro S.A. $35.87 N/A - - N/A 14.93%
NGG National Grid $42.38 9.71 4.37 8.50% 3.18 15.41%
NVS Novartis AG $50.19 11.75 4.27 3.30% 2.05 15.43%
TOT Total S.A. $49.76 8.95 5.56 4.70% 1.43 15.53%
SNN Smith & Nephew SNATS, $44.32 14.25 3.11 1.30% 3.43 15.72%
SLB Schlumberger  $58.76 23.16 2.54 1.40% 3.58 16.31%
CCH COCA COLA HELLENIC BOTTLING $23.12 15.56 1.49 1.40% 2.47 17.06%
EOC Empresa Nacional de Electricida $49.99 13.89 3.6 3.00% 3.15 17.71%
GSK GlaxoSmithKline PLC $38.14 15.59 2.45 5.00% 7.04 18.63%
CHL China Mobile Limited $52.69 12.59 4.18 3.20% 2.87 18.64%
BG Bunge Limited $54.19 3.92 13.83 1.70% 0.76 19.47%
AMX America Movil, S.A.B. $49.53 13.99 3.54 0.50% 4.75 19.81%
WSH Willis Group Holdings $29.92 11.31 2.65 3.40% 2.12 19.82%
Please be sure to calculate the payout ratios before buying these stocks. Payout ratios above 70% are cutting it close if you're not prepared for the potential downside risk. The stock symbols next to the company names take you directly to the history of dividend payments. As always, only buy these stocks if you're willing to accept losing at 50%, otherwise, the risk may outweigh the reward. Thanks again to the author of The Stock Market Advantage for the suggestion on including international stocks.

Watch List summary

Below are the companies that appeared on our international list for May 30, 2010.

Symbol Name May 30, 2010 August 13, 2010 % change
NGG National Grid $40.54 $42.38 4.54%
GSK GlaxoSmithKline $33.46 $38.14 13.99%
TEF Telefonica $57.37 $66.93 16.66%
AZN AstraZeneca $42.25 $51.39 21.63%
RUK Reed Elsevier $27.99 $33.42 19.40%
BP British Petroleum $42.95 $38.93 -9.36%
TMX Telefonos de Mexico $14.07 $14.83 5.40%
TOT Total S.A. $46.63 $49.76 6.71%
BTI British American Tobacco $58.55 $70.36 20.17%
STD Banco Santander $10.15 $12.07 18.92%
Average gain 11.81%
Double digit gains were pronounced for this group except the usual suspect BP along with Total, Telefonos de Mexico and National Grid. The previous list was ranked by dividend yield instead of those closest to the new low. However, all companies on the May 30th list were all within 10% of their respective 52%-week low.
Email our team here.

Dividend Yield is a Matter of Perspective

A reader asks:

How is it that you can characterize stocks that yield less than 2% as "dividend" stocks?

Touc's reply:

The purpose of tracking the stocks in our Dividend Achiever Watch List is because the companies have a history of increasing their dividend every year for at least 10 years in a row. The choice of selecting a Dividend Achiever based on the yield becomes up to the investor.

However, as a matter of observation, selecting stocks based solely on the "high" yield has seldom resulted in long-term financial security. In addition, my "research" has shown that stocks with a low dividend yield but a higher average annual compound growth of the dividend tend to outperform stocks with a "high" dividend yield but a low compounded annual growth rate of the dividend. For this reason, I'm willing to look more closely at the compounded annual growth rate of the dividend for lower yielding stocks. Again, this is among the many factors that go into selecting any one of the stocks on our New Low Watch List.

Another factor that we consider when selecting Dividend Achievers is the relative yield of the stock. If a stock has a history of dividend payment increases over an extended period of time then we can determine the relative buy and sell points. Buying and selling stocks based on the relative yield is explained in the books Relative Dividend Yield by Anthony Spare, Dividends Don't Lie by Geraldine Weiss and Dividends Still Don't Lie by Kelley Wright. An excellent February 20, 2010 interview of Kelley Wright's most recent book can be found on the Financial Sense website here.

One example of a low yielding stock is Helmerich & Payne (HP). We recommended the stock on Sept. 2006 because, on a relative basis, the stock was under-priced. Subsequently, we gave a sell recommendation after the stock had gained 141% in August 2008. We later recommend HP when, on a relative basis, it was attractively priced in March 2009. Since March 2009, the stock has increased over 80% to the current price of $40.52. The point is that, on an absolute basis, the yield on HP never reached 1.50% when the stock was at its lowest price (high price = low yield/low price = high yield.) However, on a relative basis, the yield was very high for the stock.

It is far more important to focus on the history of dividend increases rather than the yield. Once you’ve narrowed down the quality stocks based on dividend increases then it is suggested that you compare the current dividend yield to the historical range for the stock in question. At least, this is the way the New Low Observer team likes to look at dividend paying stocks, regardless of the yield.

-Touc

Wal-Mart To Report Tomorrow

Wal-Mart Stores (WMT) is set to report earnings tomorrow. What I will be paying attention to is not so much the earnings but the possible dividend announcement. Wal-Mart is a veteran when it comes to rewarding shareholders with dividends. They have been paying and increasing their dividends for roughly 35 years. Over the past 10 years, the compound annual growth rate of the dividend has been 18.5%! Over the same period, WMT's share price has not performed in a similar fashion, thus value has been building up. This may be the reason why Warren Buffett has been increasing his stake in the company.
Through the deepest and darkest hour of our economy, Wal-Mart managed to raise the dividend by 8% in 2008 and 15% in 2009. Given this track record, I would estimate that at least a 10% rise in dividend payment is likely. Click here for historical dividend and stock splits.
Would I be buying it now? It depends. The shares of WMT are not extremely expensive but since it ran up from the $50 range when I wrote about it in September 2009, I would suggest a pull back to that range before buying. If you are excited about this company and wish to buy right now, then I suggest you divide your buying in two parts. Buy the first portion now and wait for a 20% decline to buy the second half.
The key point is that quality companies that pay and increase dividends consistently tend to become great investments when they appear on our watch list. Not all companies are to be bought but our list is a great starting point for any conservative investor or aggressive trader. - Art