Category Archives: Dow Theory Letters

Richard Russell Review: July 5, 1974

This from Dow Theory Letters on July 5, 1974.

"What’s happening, what’s gone wrong? The answer: there's a giant squeeze in world liquidity, and it is scaring the devil out of investors, large and small, from one end of the globe to the other. Last week two German banks declared bankruptcy, while it was revealed (WSJ, June 26) that an oil-drilling "tax write-off" situation has turned into what may be the biggest swindle in US history. On June 27 trading in Westinghouse was halted at 12 1/8 (“you can be short if it’s Westinghouse”), and an hour later the President of the company announced that the outfit was solvent (all this while WX broke its 1962 low) (page 1)."

Those two German banks were Bankhaus I.D. Herstatt of Cologne and Bass & Herz Bankhaus.  This was a situation where the failure of Herstatt led to the failure of Bass & Herz and a host of other substantial losses. 

Chase Manhattan Bank was in possession of $156 million in Herstatt deposits.  This meant that U.S. creditors (namely Citibank’s British banking unit of Hill, Samuel & Co.) were seeking claims on these funds even though Chase Manhattan had no authority to recognize the claims. 

Seattle First National Bank (SeaFirst) was caught in a bind when they performed a $22.5 million transaction at their Swiss subsidiary and the funds were not transferred to the parent company hours before Herstatt was forced into bankruptcy.

In classic scam fashion, the oil-drilling "tax write-off" scheme was named Home-stake Production Company of Tulsa Oklahoma.  Using the name “Homestake” tied the swindler with the success and stability of Homestake Mining while not having achieved anything of note. 

What made this swindle exceptional is the fact that people like Liza Minelli, Candice Bergen, and Buddy Hackett (as well as Congressmen) were involved in the money losing fraud.  The motivation for getting into these “tax write-off” schemes might have been inspired, at the peak, by articles like the following from Barron’s in March 1974.

image

“Bank shares at 10% yields mean that investor are scared of the banks (page 2).”

It was not long before this comment was published on banks that banks were on a mad dash to lure investors and analysts.  In a Barron’s article titled “Beautiful Balloon?” it was indicated that the 1970  amendment to the Bank Holding Company Act of 1956 led banks “…into related (and some not-so-related) financial areas.

image

It was those related financial areas that banks had “…been heavily engaged in financing real estate activities, and, despite the debacle among REITs, thus far have escaped essentially unscathed.”  It wasn’t long before those banks almost paid the price for their foray into REITs, until the government intervened.  This article from Barron’s should have been titled “Beautiful Bubble” as the collapse was in the early stages at this time and by July 5, 1974, there was more pain until December 1974, to the tune of –27.04% in the Dow Jones Industrial Average.

image

see also: Homestake Mining: The Exception that Proves the Rule

Inventory-Sales Ratio

Richard Russell’s Dow Theory Letters dated March 20, 1970:

“Sales and Inventories: The accompany chart from the Journal of Commerce (thanks to Humphrey Neill) shows an interesting picture, the critical sales to inventory ratio. When business is expanding, and we note on the chart that the long upward rise in the FRB production index [Industrial Production Index] signifies that it has been expanding, manufacturers tend to become increasingly bullish. Consequently, they also seek to build up their inventories in anticipation of increasing business (and as a hedge against inflation.)

image

“Then, as a slowdown in sales appears, it usually catches manufacturers either unaware or unable to adjust their inventories fast enough. Those who see the slowdown coming may cut back their inventory building in anticipations. This is termed to voluntary inventory cutting. But in most cases a belated recognition of a sales slowdown hits manufacturers. Then they are faced with a problem; sales are declining, and they have far too many goods coming in on order. The next step is canceling unwanted orders and cutting back on future orders. This is the process known as in voluntary inventory cutting, and it is undoubtedly happening now (page 5).” Continue reading

Richard Russell Review: Letter 1248

On this date in 1998, Richard Russell published Issue 1248 of the Dow Theory Letter.  At the time, the Dow Jones Industrial Average was at the 8,872.79 level and the Transportation Average was at 3,517.52.

image

Russell opens his newsletter by pointing out the distinction between what the market “should be doing” versus what was actually happening.  What was happening?  The market was defying all long-term conventional norms.  In Russell’s word’s, “The conclusion -- always -- is exhaustion.”  Russell felt that the market’s rise was at a mania level and that investing in such a market was clearly a personal choice but that “values will out.”

Continue reading

Richard Russell: The Passing of an Icon

image

Read the full tribute here

Dow Theory: The Misunderstood Barometer

Dow Theory is a fickle beast.  While the theory is sound, those that interpret it have their challenges.  A recent article dated May 21, 2015 titled “Transportation Average – A Big Concern for Stock Bulls?” by Chris Ciovacco presents some of the difficulties with the topic of Dow Theory. In this article, we’ll attempt to clarify some issues that should be discussed when making interpretations of Dow Theory.

The article by Ciovacco starts off by pointing out the recent divergence between the Dow Jones Transportation Average and the Dow Jones Industrial Average.  A divergence exists when one index makes new highs or lows while the other index fails to go in the same direction.  According to Dow Theory, if there is a divergence, it could indicate that the previous trend will be reversed.  As the prior trend in the stock market from 2009 to 2015 has been bullish, the implication is that the bull market could be coming to an end.

image

In explaining whether investors should be worried about the “non-confirmation” exhibited by the divergence between the Industrial and Transportation Averages, the article identifies the period from 1989 to 1993 when there appeared to be a divergence between the same indexes.  However, at the time of the divergence, according to the author, the S&P 500 managed to gain as much as +25%.  What is not shown or discussed are the key indications of a bull or bear market in the period from 1989 to 1993.  These elements will complete a picture that is necessary for anyone hoping to understand and possibly benefit from Dow Theory.

Identifying the Bear Market

Below is a charting of the period 1989 to 1993 in smaller segments for a more accurate Dow Theory assessment.  First is the indication of a bear market based on Dow Theory which occurred on October 13, 1989.

image

Our ex post interpretation of when a bear market was signaled by Dow Theory is supported by the Dow Theorist Richard Russell in his Dow Theory Letters publication. In his official investment stance on October 4, 1989, Russell said:

image

This is contrasted by what Russell said in his October 18, 1989 posting:

image

Russell made clear that from a Dow Theory perspective, a bear market had been signaled.  As a side note, Russell’s PTI or Primary Trend Indicator did not confirm the bearish signal until February 7, 1990 (four months later).  The PTI is not a part of Dow Theory but has proven to be a useful market tool.

Identifying the Bull Market

Using our own ex post analysis of the charts of the Dow Jones Industrial Average and the Dow Jones Transportation Average, we find that a new Dow Theory bull market was signaled on January 18, 1991.

image

Richard Russell was suspicious of the Dow Theory bull market that was signaled on January 18, 1991 and chose to wait for his PTI to give the all clear.  Russell said the following on February 6, 1991:

image

But even the preceding commentary was buried by the following overriding thoughts by Russell:

image

The question is ultimately asked by Ciovacco, “Would it have made sense to sell all our stocks because the Dow Transports failed to make a new high?”  The point being, why get caught up in a “signal” that potentially will result in lost investment gains? After all, the S&P 500 index increased by +25% in the period when it appeared that there was a divergence between the Dow Jones Industrial Average and Dow Jones Transportation Average.

This is where a significant problem comes up in the analysis of Dow Theory.  First, if we assume that a divergence did occur in Ciovacco’s selected time frame, rather than a bear market indication, then an adherent of Dow Theory would accept that a divergence is merely a caution signal.  This would have meant that whatever the previous trend of the market was, it remains in place until a definitive reversal occurs.  In our most recent market action, a bull market was still the indication and thus there would be  no need “… to sell all our stocks…”

Another issue not mentioned is that Dow Theory does not give buy or sell signals as we pointed out in our July 25, 2011 article. Among the many things overlooked about Dow Theory is that it is intended to reflect the changes in the stock market, investment values, and the economy.  As a barometer, it merely indicates the direction that the stock market and economy might go three to nine months into the future. Those who take bull or bear market indications as buy or sell signals still need to be well versed in understanding values and compounding and their role in investing. If a person, not versed in values and compounding, believes that any indication means that they can haphazardly buy or sell stocks then they are most likely to suffer severe losses and quickly become disenchanted with the accumulation of assets.

Identifying Recessions

In the past, Dow Theory was often heralded as a peek into the future for the economy.  In the 1989 example above, the Dow Theory bear market preceded the National Bureau of Economic Research’s (NBER) definition of a recession by nine months.  Dow Theory signaled a bear market in October 1989 and the NBER indicated that a recession began July 1990.  However, the NBER announced their conclusion about when the recession began on April 25, 1991, a full year and a half after the Dow Theory bear market signal and nine months after their own designation of when the recession began.  Additionally, Dow Theory indicated that a new bull market was in place on January 18, 1991 or three months before the NBER announced that the recession ended in March 1991.

Final Thoughts

What some market bears would like to accomplish with Dow Theory is to anticipate scenarios where divergence leads to an actual bear market of significant magnitude like what happened in the period from 1972 to 1974.

DT '72

The decline experienced from the respective peaks was –59% and –44% for the Transports and Industrials.  Since the outcome of a divergence cannot be accurately anticipated, it is far “safer” to wait for the confirmation of the trend before considering any potential actions.  However, if investors had sold their stocks on October 13, 1989 and repurchased stocks on January 18, 1991 (and held until December 31, 1993), the gains would have been +40%, +41% and +76.04% for the S&P 500, Industrials and Transportation Index, respectively.

What some market bulls would like to accomplish without Dow Theory is not selling if the net effect is for the market to ultimately climb well beyond the point of the initial divergence.  As an example,  if we take the October 13, 1989 date and calculate the returns for the S&P 500, Dow Industrials and Dow Transports until December 31, 1993, we find that the returns were +39%, +46% and +25%, respectively.

Dow Theory only works as a barometer for the stock market when taken in the context of investment values and compounding.  As an indicator of coming recessions, as defined by NBER, Dow Theory has an unrivaled track record.  The translation of these ideas often get confused as recessions don’t necessarily result in jarring –50% declines in the stock market every time.

Our tactic on the divergence is to dump more funds into the cash portion of the brokerage account so that we can make large purchases if a precipitous decline ensues.  If a decline does not materialize, we will continue our slow and selective investment buying program for compounding purposes.

Richard Russell Review: Letter 554

Dow Theory Letters Issue 554 was written on February 7, 1973. At the time, the Dow Jones Industrial Average was indicated to be at the 968.32 level.  This was at a point prior to the Dow Industrials declining –40% while the Dow Transports declined –37% to the late 1974 lows.

Continue reading

Thoughts on Gold

A reader says:
“There's a reason Gold is the hottest in the world.Investors are simply losing faith in ALL fiat currencies. Hence, they areturning to one thing that has always been real money - GOLD!”
Our Take:
We don’t know about the far distant future of gold,governments and profligate spending. However, we've always enjoyed a historical perspective on the topic of “realmoney.”  We’ve pulled a few quotes fromRichard Russell’s Dow Theory Letterson the topic of “real money” in the same vein as described above.
The US is on a treadmill to disaster via the creation ofdebt. In time (and the time is moving very rapidly now) the debt will destroyalmost ALL forms of investments. Gold will withstand the destruction, becausereal money is never destroyed.” 
Dow TheoryLetters.  Issue 736. August 7, 1978. Page5.
Coming up in a month, a year, a few years (I can’t time it)is the BIG PROBLEM, the problem that I’ve warned about for a long time. How doyou get people to hold paper “money” when they have increasing doubts about itsworth? The answer: you must make it CONVERTIBLE into real money-gold.”
Dow TheoryLetters.  Issue 766. September 26, 1979. Page1.
My job now seems to be to try to save my subscribers fromthe deceitfulness and greediness of our own Government. So I talk about thetechnical position of gold, of where WC are, of whether gold is still a buy andwhether it will take 900 or 1000 paper dollars to buy an ounce of real moneysay six months or maybe even three months from now." 
Dow Theory Letters.  Issue 774. January 16, 1980. Page 7.
‘How can the Government ever be bankrupt if it is able to createmoney?’ The answer is that the Government could only be bankrupt if no onewould accept that money. And of course, that possibility is the reason why manysurvivalists will ‘never be without some kind of a position in real money -gold.’” 
Dow Theory Letters. Issue 805.March 25, 1981. Page 3.
Why could gold be bullish? Two opposing reasons: first,with a potential crisis in the world monetary system, people turn to real moneyas an insurance policy. Gold is real money. Second. With unbearable deficits facingthe US over coming years, politicians will be tempted to ‘print’ (monetize)some of those deficits (and suppose Edward Kennedy gets in in ‘84).
Dow TheoryLetters. Issue 841. August 11, 1982. Page 6.
Now, we’re not suggesting that the ultimate consequence ofprofligate spending isn’t coming.  Additionally,we’ve made a call for a secular bull market (as opposed to a cyclical bullmarket) in gold on September28, 2010 and silver on September5, 2009 .  However, much of thearguments during and after the peak in the price of gold are the same as today. 
Additionally, nothing has changed that was said about profligatespending at the peak in the price of gold in 1980 or the period from 1981 to1999, a time when the price of gold was in a declining trend.  Therefore, we have little to help us distinguish the difference between huge government spending when gold is rising and when gold is falling.  We're sticking to the view that Dewey and Dakins' assertion that gold vacillates in a 50 to 54-year cycle is right on target (our 2009 review of their work here). 


We’re opting for the view that goldexperiences good times and bad rather than the view that our nation is comingto an end.  After all, the redemption ofour gold, as with all forms of insurance, is not something that we look forwardto.

4-Year Cycle Update

On June14, 2010, we wrote an article titled “AMarket Cycle Worth Observing.”  Inthat article, we proposed that there was significant validity in the beliefthat the stock market ebbs and flows in a 4 to 4 ½ year cycle.
In aneffort to make our point, we provided examples from Charles H. Dow, co-founderof the Wall Street Journal, and Richard Russell editor of the Dow Theory  Letters (www.dowtheoryletters.com).  The examples were drawn from the late 19thand 20th century.  The purposeof connecting such disparate periods was to show that regardless of the changein times, some attributes of the stock market remain intact.
In ourclosing paragraph on the 4-year cycle we said the following:
“If my observations on thistopic are correct, then we have at least until January 2011 to June 2011 beforethe half cycle is complete. Afterwards, the market would either trade in arange or establish a well-defined bottom in accordance with the 4 to 4 ½ yearmarket cycle.”
Ourarticle of June 14, 2010 came after an -11% decline in the Dow Jones IndustrialAverage.  Subsequent market action led tothe Dow Jones Industrial Average rising +25.71%.  Coincidentally, the Dow Industrials peaked onApril 29, 2011 at 12,810.54 with two failed attempts at reaching new highs inJuly 2011.
Because we’rewithin 9 months of the second half of the 4-year cycle, we believe that thereis approximately another year to go of the stock market continuing to trade ina range or reaching an ultimate low.  
For themarket to trade in a range we expect that the Dow Jones Industrial Average doesnot exceed the high of 12.810.54 by more than 10% while not falling below10,655.30.  If both the Dow Industrialsand Dow Transports exceed their respective highs we would view such action as anew cyclical bull market.  Our downsidetarget for an ultimate low on the Dow Jones Industrial Average is tentativelyset at 8,540.36.
Althoughgiving our prognostication one year in advance (as indicated in an April 2010posting below), we were off by only one month for the last peak in the market. Furthermore, the evidence suggests that the 4-year cycle is still inplay.  We feel that an appropriateinvesting strategy can be constructed around this concept.  If investing in stocks is a must, then we’drecommend considering the relatively undervalued current and former dividendincreasing stocks from our latest dividend list below.
Symbol
Name
Price
P/E
EPS
% Yield
Price/Book
% from Low
Tootsie Roll
23.77
32.82
0.72
1.40
2.03
4.12%
C.R. Bard, Inc.
85.81
22.05
3.89
0.90
3.96
6.14%
Becton, Dickinson
74.24
13.22
5.62
2.50
3.26
6.70%
John Wiley & Sons
44.77
15.7
2.85
1.80
2.66
6.88%
California Water Service
17.83
18.29
0.98
3.40
1.64
7.09%
Owens & Minor
27.8
15.61
1.78
2.90
1.93
7.46%
Clorox Company
67.76
19.54
3.47
3.60
-116.98
8.64%
West Pharmaceutical
38.55
21.28
1.81
1.90
1.85
8.73%
Frisch's Restaurants
20.27
22.93
0.88
3.30
0.8
9.92%

End of September Market Commentary

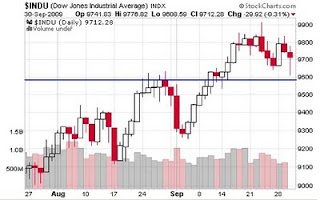
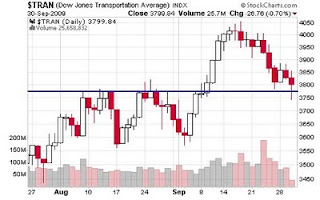
Today's action was a close one for the market. The Transport index, at one point, broke below the previous high from late August. The Industrial Index is still well above the previous high so nothing to worry about there. If the Transports were to closed below the previous high, we would have the first part of the non-confirmation move under the Dow Theory.
Note: If you are not familiar with the Dow Theory, please read a free description from Dow Theory Letter or StockCharts, but I recommend reading Richard Russell's Letter.
Coppock Curve
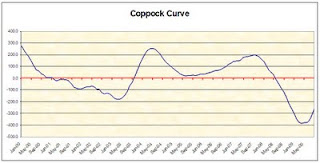
At the end of September, the Coppock Curve or Index remained bullish. People who understand the Coppock Curve may wonder why I still keep track of the curve since the buy signal was given to us in May. My answer is that I don't want to this to be a false buying signal such as the one in 2001. The curve rose by 53.8 points, the highest since the buy signal was triggered.


Summary
We are cautiously bullish on the market. We are looking to purchase Northwest Natural Gas (NWN) and Cardinal Health (CAH). This will depend on what the overall market does when we start October.
Art