Category Archives: Dow Theory Non confirmation

Dow Theory: Technical Take

We outline the current market conditions based on the technical attributes applying the work of Charles H. Dow.

Continue reading

Dow Theory: The Misunderstood Barometer

Dow Theory is a fickle beast.  While the theory is sound, those that interpret it have their challenges.  A recent article dated May 21, 2015 titled “Transportation Average – A Big Concern for Stock Bulls?” by Chris Ciovacco presents some of the difficulties with the topic of Dow Theory. In this article, we’ll attempt to clarify some issues that should be discussed when making interpretations of Dow Theory.

The article by Ciovacco starts off by pointing out the recent divergence between the Dow Jones Transportation Average and the Dow Jones Industrial Average.  A divergence exists when one index makes new highs or lows while the other index fails to go in the same direction.  According to Dow Theory, if there is a divergence, it could indicate that the previous trend will be reversed.  As the prior trend in the stock market from 2009 to 2015 has been bullish, the implication is that the bull market could be coming to an end.

image

In explaining whether investors should be worried about the “non-confirmation” exhibited by the divergence between the Industrial and Transportation Averages, the article identifies the period from 1989 to 1993 when there appeared to be a divergence between the same indexes.  However, at the time of the divergence, according to the author, the S&P 500 managed to gain as much as +25%.  What is not shown or discussed are the key indications of a bull or bear market in the period from 1989 to 1993.  These elements will complete a picture that is necessary for anyone hoping to understand and possibly benefit from Dow Theory.

Identifying the Bear Market

Below is a charting of the period 1989 to 1993 in smaller segments for a more accurate Dow Theory assessment.  First is the indication of a bear market based on Dow Theory which occurred on October 13, 1989.

image

Our ex post interpretation of when a bear market was signaled by Dow Theory is supported by the Dow Theorist Richard Russell in his Dow Theory Letters publication. In his official investment stance on October 4, 1989, Russell said:

image

This is contrasted by what Russell said in his October 18, 1989 posting:

image

Russell made clear that from a Dow Theory perspective, a bear market had been signaled.  As a side note, Russell’s PTI or Primary Trend Indicator did not confirm the bearish signal until February 7, 1990 (four months later).  The PTI is not a part of Dow Theory but has proven to be a useful market tool.

Identifying the Bull Market

Using our own ex post analysis of the charts of the Dow Jones Industrial Average and the Dow Jones Transportation Average, we find that a new Dow Theory bull market was signaled on January 18, 1991.

image

Richard Russell was suspicious of the Dow Theory bull market that was signaled on January 18, 1991 and chose to wait for his PTI to give the all clear.  Russell said the following on February 6, 1991:

image

But even the preceding commentary was buried by the following overriding thoughts by Russell:

image

The question is ultimately asked by Ciovacco, “Would it have made sense to sell all our stocks because the Dow Transports failed to make a new high?”  The point being, why get caught up in a “signal” that potentially will result in lost investment gains? After all, the S&P 500 index increased by +25% in the period when it appeared that there was a divergence between the Dow Jones Industrial Average and Dow Jones Transportation Average.

This is where a significant problem comes up in the analysis of Dow Theory.  First, if we assume that a divergence did occur in Ciovacco’s selected time frame, rather than a bear market indication, then an adherent of Dow Theory would accept that a divergence is merely a caution signal.  This would have meant that whatever the previous trend of the market was, it remains in place until a definitive reversal occurs.  In our most recent market action, a bull market was still the indication and thus there would be  no need “… to sell all our stocks…”

Another issue not mentioned is that Dow Theory does not give buy or sell signals as we pointed out in our July 25, 2011 article. Among the many things overlooked about Dow Theory is that it is intended to reflect the changes in the stock market, investment values, and the economy.  As a barometer, it merely indicates the direction that the stock market and economy might go three to nine months into the future. Those who take bull or bear market indications as buy or sell signals still need to be well versed in understanding values and compounding and their role in investing. If a person, not versed in values and compounding, believes that any indication means that they can haphazardly buy or sell stocks then they are most likely to suffer severe losses and quickly become disenchanted with the accumulation of assets.

Identifying Recessions

In the past, Dow Theory was often heralded as a peek into the future for the economy.  In the 1989 example above, the Dow Theory bear market preceded the National Bureau of Economic Research’s (NBER) definition of a recession by nine months.  Dow Theory signaled a bear market in October 1989 and the NBER indicated that a recession began July 1990.  However, the NBER announced their conclusion about when the recession began on April 25, 1991, a full year and a half after the Dow Theory bear market signal and nine months after their own designation of when the recession began.  Additionally, Dow Theory indicated that a new bull market was in place on January 18, 1991 or three months before the NBER announced that the recession ended in March 1991.

Final Thoughts

What some market bears would like to accomplish with Dow Theory is to anticipate scenarios where divergence leads to an actual bear market of significant magnitude like what happened in the period from 1972 to 1974.

DT '72

The decline experienced from the respective peaks was –59% and –44% for the Transports and Industrials.  Since the outcome of a divergence cannot be accurately anticipated, it is far “safer” to wait for the confirmation of the trend before considering any potential actions.  However, if investors had sold their stocks on October 13, 1989 and repurchased stocks on January 18, 1991 (and held until December 31, 1993), the gains would have been +40%, +41% and +76.04% for the S&P 500, Industrials and Transportation Index, respectively.

What some market bulls would like to accomplish without Dow Theory is not selling if the net effect is for the market to ultimately climb well beyond the point of the initial divergence.  As an example,  if we take the October 13, 1989 date and calculate the returns for the S&P 500, Dow Industrials and Dow Transports until December 31, 1993, we find that the returns were +39%, +46% and +25%, respectively.

Dow Theory only works as a barometer for the stock market when taken in the context of investment values and compounding.  As an indicator of coming recessions, as defined by NBER, Dow Theory has an unrivaled track record.  The translation of these ideas often get confused as recessions don’t necessarily result in jarring –50% declines in the stock market every time.

Our tactic on the divergence is to dump more funds into the cash portion of the brokerage account so that we can make large purchases if a precipitous decline ensues.  If a decline does not materialize, we will continue our slow and selective investment buying program for compounding purposes.

Dow Theory: Industrial Production Tipping the Scales

This is our first update to Dow Theory review since October 17, 2014.  At the time, we closed with the following commentary:

“All reasonable interpretations of Dow Theory should indicate that we are in a bear market.

“Most Dow Theorists would suggest that investors sell all stock holdings in order to avoid losses.  However, we only use Dow Theory as an asset allocation tool.  Therefore, we will add cash to our holdings and trim some positions.  Outright selling of all stock positions is not conducive to the concept of compounding income, which is our long-term goal.

“Finally, all is not lost.  In order to change the view that we are in a bear market, the Dow Industrials, Transports and Russell 2000 only need to exceed their previous all-time peaks.  This partially explains the reason why it may not be advisable to sell all positions based on a Dow Theory bear market indication.”

Our assessment of a Dow Theory bear market indication was supported by an October 19, 2014 posting by Dow Theorist Tim Wood.  In his review of Dow Theory, Wood said:

“This all said, on Friday, October 10, 2014, the Transports closed below their August 7th Secondary Low Point. On Monday, October 13, 2014, the Industrials followed with a close below their August 7th Secondary Low Point. In the wake of this development, I have sat quietly to see what, if anything, would be written on this development. The current Dow Theory chart can be found below. As a result of this joint close below the previous secondary low points, an orthodox Dow Theory Primary Bearish Trend change has been triggered (Wood, Tim. Dow Theory Update. October 19, 2014.)”

Seven months later, the changing market conditions indicate that commentary on Dow Theory is necessary.

Continue reading

Dow Theory: September 18, 2014

NOTE: In our  Dow Theory posting of May 18, 2014, we revealed an issue with Dow Theory that had gone unaddressed since S.A. Nelson’s book, The ABC of Stock Speculation, coined the term “Dow’s Theory.” We believe the acknowledgment of this issue adds clarity to the writings of Charles H. Dow and may produce new insights that have not previously been explored.

Continue reading

Dow Theory

Continue reading

Apple’s Pain May Be a Warning for the Dow Indices

Since the bull market run began in 2009, Apple (AAPL) analysts have been making persuasive arguments for the stock.  The fundamental case for Apple includes price-to-earnings, price-to-sales, cash reserves, China as an untapped market, etc.  However, as investors have found out, it is the price that matters most as Apple’s stock has taken a hit from the high of $702 on September 19, 2012 to the current price of $443 (March 18, 2013).  While fundamentals are important, there is one obvious problem and that is the trading volume.

In the section on Dow Theory, in the Edwards and Magee book Technical Analysis of Stock Trends, volume is interpreted in the following manner:

“…in a Bull Market, volume increases when prices rise and dwindles as prices decline; in Bear Markets, turnover [volume] increases when prices drop and [volume] dries up as they [prices] recover (33).”

When we compare the previous bullish moves in Apple’s stock price, we find that the most recent run-up stands out as trading volume has not only failed to increase with the stock price, it has been on a divergent path by declining.  However, we need to see how different this most recent rise in the stock price is in contrast with the previous bullish moves.

In the bull market run of Apple from December 30, 1997 to February 29, 2000, the stock price rose +900% while average trading volume increased +1,000%.

image

In the bull market run of Apple from April 1, 2003 to December 30, 2007, the stock price rose over +1,400% while average trading volume increased +1,000%.

image

In the bull market run of Apple from January 21, 2009 to the present, the stock price rose nearly +900% while average trading volume decreased -51%.

image

The obvious problem with the current rise in the price of Apple from the January 21, 2009 low to the September 19, 2012 high is that while the stock price has increased dramatically, the trading volume has fallen precipitously. Already, Apple has inexplicably declined –36% from the high. There is little in the way to indicated that the blood-letting is over.

According to Robert Rhea, in his book The Dow Theory, “…the volume of trading has proved to be such a useful guide in attaining proficiency in the art of forecasting market trends that it is necessary to urge all students to study intently the relation of volume to price movement (88).”

It would be foolish for us to think that the decline in volume, from 2009 to the present, while the stock price increased wasn’t a warning sign. It is suggestive of the fact that all was not well and therefore the party had to end at some point in time.  This is despite the otherwise glowing fundamentals that are associated with Apple.

Now, if the almighty Apple can decline –36% in spite of the glowing fundamentals as the Dow Industrials and Dow Transports keep going higher, then what is the fate of two main components of Dow Theory?  By all indications, we should be considered to be in a bear market based on the fact that the price of the Industrials and Transports is increasing as the trading volume dries up.

From our vantage point, there are two distinct outcomes possible for the stock market, based on the above quoted sources.  Either the stock market explodes higher than anyone has ever imagined possible or the stock market declines, –20% to –30% from the current level, as average trading volume skyrockets.  However, our experience so far has been for volume to decrease as the price increased.  Therefore, by our logic, when and if volume starts to increase it will be because institutions will be selling instead of buying the market.

While we have constructed two possibilities, the probabilities are something else altogether.  We think that the fact that volume has been in a clear declining trend, the probabilities favor a decline of the stock market over a sustained increase.  To put this idea into perspective, when we wrote our April 14, 2012 article titled “Consider the Downside Prospects for Apple,” we said that Apple would decline to $424 (found here).  After the article was written, Apple increased by +11%.   However, after Apple peaked, the stock declined –30% from the price where our article was written.  Our only question is, was it worth seeing a rise of +11% only to realize a loss of –30%?

Notes:

  • Because we have a substantial amount in cash and a majority of our holdings that are the profit portion intended to compound over time, we are only compelled to sell those positions that are recent short-term purchases that are more than 5% of our existing portfolio.
  • Our Canadian Dividend Watch List should be coming out this week

Dow Theory: The Beginning of a Cyclical and Secular Bull Market?

The world of Dow Theory was abuzz after the Dow Jones Industrial Average and the Dow Jones Transportation Average charged to all-time highs on March 5, 2013 (found here).  At the time, the Dow Jones Industrial Average had finally capitulated to the inexorable forces that had long since propelled the Dow Jones Transportation Average above the 2011 all-time high.  The confirmation of a Dow Theory bull market came when the Dow Jones Industrial Average finally exceeded the all-time high of 14,164 set in October 2007.

The action of the Dow Industrials and Transports has been so compelling that Dow Theorist Richard Russell acquiesced to the strength of the market on March 11, 2013 by saying the following:

“Yes, I know that this market is uncorrected during its long rise from the 2009 low, and I know that there are risks in buying an uncorrected advance that is becoming uncomfortably long in the tooth, but my suggestion is that my subscribers should take a chance (after all, Columbus took a chance) and take a position in the DIAs.”

In the same posting, Russell later punctuates the point by saying:

“I really believe that subscribers should take a flyer on this market. After all, after weeks of flirting with a new high in the Industrial Average, the Dow finally confirmed the previous record high of the Transportation Average. With the Industrials and the Transports both in record high territory, I think being in the market is justified under Dow Theory.”

By all indications, this Dow Theory bull market indication is the real deal, especially when it is endorsed by Russell’s 55 years of experience on the topic.  The implications of this signal are significant for one very important reason, this time we’ve achieved a secular bull market indication (learn about cyclical and secular trends).

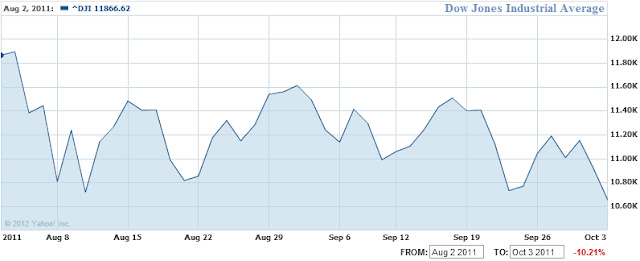
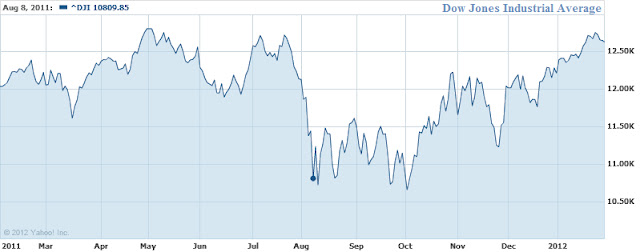
Throughout stock market history, cyclical primary bull markets tend to last 2-4 years.  These bull markets require rapt attention to the nuances and vagaries of changes in the trend.  The last indication of a cyclical primary bull market was on July 23, 2009, when the Dow Industrials traded at 9,069.29.  Based on our interpretation of Dow Theory, we received a cyclical primary bear market indication on August 2, 2011 when the Dow Jones Industrial Average was at 11,866.62.

Secular bull markets, on the other hand, require very little attention and have typically lasted between 15 and 18 years.  Secular bull markets are the proverbial sweet spot of investing with the trend, where “buy-and-hold” is the rule. The two most prominent secular bull markets resulted in the Dow Jones Industrial Average increasing by 10-fold or more. From 1942 to 1966, the Dow rose from 100 to 1000 and in the period from 1982 to 2000, the Dow went from 1,000 to 11,722. If the current implications are correct, we could be on the cusp of a run to Dow 100,000.

Volume: The Lone Holdout

The three major components of Dow Theory are the Industrials, Transports and trading volume.  As described above, the Industrials and Transports have achieved the required all-time highs at (or near) the same time which would indicated that we are in a new cyclical AND secular bull market.  However, volume has been the holdout in the current move higher.

In the seminal book on Dow Theory titled The Stock Market Barometer, written by William Peter Hamilton, it says the following about trading volume, “It is worth while to note here that the volume of trading is always larger in a bull market than in a bear market. It expands as prices go up and contracts as they decline.

The average trading volume for the Industrials and Transports has been in a declining trend (contracting) since the 2009 low, as seen in the charts below.

image

image

In order for Dow Theory to have relevance, increasing volume needs to accompany the rise of the stock market to ensure that there is sufficient participation and interest.  Unfortunately, average trading volume, as indicated in the above charts for the respective indexes, has been trending lower since 2009.  This suggests that we could only be in an extended  cyclical bull market, within a secular bear market, rather than at the beginning of a cyclical and secular bull market.  The key to understanding trading volume and its interpretation are found in the table below.

volume price interpretation
decrease decrease positive
decrease increase negative
increase decrease negative
increase increase positive

In the days before volume was tabulated for the individual Dow indexes, the New York Stock Exchange trading volume was the proxy for the market trend in conjunction with the Industrials and Transports.  Below is the  200-day average trading volume of the NYSE since 2001.

image

What is evident is the dramatic rise and peak of average trading volume during the decline of the stock market from the peak in 2007 to the bottom in 2009.  However, once the market started taking off, the trading volume uncharacteristically plunged.  To emphasis the point, below we have included the charts for the cyclical bull markets from 2001-2007 and 2009 to the present.

image

In the chart from 2001, we can see that NYSE average trading volume hit a peak in 2002 and then flat-lined for a couple of years until 2005.   However, as the strength in the stock market grew, the trading volume accelerated to new highs.  This was the hallmark of a true bull market run, rising prices and rising volume.

image

In the chart from 2008, the average trading volume for the NYSE has had a declining trend throughout the whole bull market run from 2009 to the present.  As indicated in the table above, declining volume with increasing prices should be interpreted as a negative.  After volume has been in a declining trend for so long, the only alternative is for a dramatic increase.

When the increase in volume arrives, the question then becomes, will there be a dramatic increase or decrease in stock market price?  Will the general public’s lack of participation be the catalyst that charges the market to move higher?  This situation has to be resolved at some point.

To round out our thoughts on the potential secular bull market signal that we recently received, we thought we would compare it to the last secular bull market change in trend.  In the period from 1966 to 1982, the Dow Industrials never traded significantly above 1,000.  However, that all ended in late 1982 when the stock market broke above 1,000 and never looked back.

Below is a chart of the Industrials, Transports and NYSE trading volume from March 1982 to November 1982:

image

The most important information to be gleaned from this chart is the fact that all three of the essential indicators for Dow Theory were confirming each other at a critical point in time.  They all achieved clear bull market indications by rising in unison.  The current divergence between the Dow indexes with the NYSE trading volume suggests that we will be witness to the greatest transition in the history of the stock market.

The above examination of trading volume, based on a what we believe to be reliable sources, has us concerned that a new secular bull market is not really what we’re witness to.

As William Peter Hamilton has said in The Stock Market Barometer:

“The professional speculator is no more superfluous than the pressure gauge of the steam-heating plant in your cellar. Wall Street is the great financial power house of the country, and it is indispensably necessary to know when the steam pressure is becoming more than the boilers can stand.”

The pressure in the market is building and we may be watching the beginning of the most spectacular stock market blow-off ever.  Just before an even more astonishing decline.

Dow Theory Update

On May 19, 2012, we said that the bear market rally had ended (found here).  In our view, we believed that the Dow Jones Jones Industrial Average would not exceed the high of 13,279.32 set on May 1, 2012.  The most recent run of the Dow Industrials is causing us to wonder if our assessment was correct.

Despite our concern that the Dow Industrials will increase above 13,279.32, we do need to point out  two technical non-confirmations of the market that have been established so far.  First is the secular (long-term) level of the market.  Ordinarily, the secular (long-term) trend of the market would be bullish when and if both the Industrials and Transports rise above their respective 2007 to 2012 peaks.

As can be seen in the chart below, the horizontal black lines shows that the Transportation Index managed to rise above the prior high of 2007/2008.  At the same time, the Dow Jones Industrial Average did not come as close to the prior highs.  This lack of confirmation suggests that we are still in a secular (long-term) bear market.

image

At the same time, on a cyclical basis (short-term), as indicated by the green lines above, the Dow Jones Industrial Average and Transportation Average have gone their separate ways.  The Dow Jones Industrial Average trending higher while the Dow Jones Transportation Average has trended lower.

So far, all indications are that we’re in a cyclical and secular bear market.  Since our bear market indication of August 2, 2011 (found here), we have not received any indication to the contrary.  However, if we’re completely wrong about the bearish direction of the market, a Dow Theory bull market indication on a cyclical basis (short-term) would occur if the Dow Industrials and Transports were to increase above 13,279.32 and 5,627.85, respectively.  Additionally, a bull market indication on a secular basis (long-term) would occur when the Dow Industrials and Transports exceed their respective highs in the period from 2007 to 2012.

Despite our concern for the bear market that we are in, we continue to pursue the policy of accumulating stocks that appear reasonably undervalued which is in accordance with Charles H. Dow’s emphasis on values at a reasonable prices. Our most recent purchases of Carbo Ceramics (CRR) and Expeditors International of Washington (EXPD) brings our partnership portfolio to 57.78% in stocks and 42.22% in cash.

Broader Market and Dow Theory Suggest Proceeding with Caution

As the Dow Jones Industrial Average and S&P 500 exceed the highs set in 2011, there is an alarming coincidence with 1972, just before the Dow Industrial’s -44% decline, that we’d like to bring to your attention.  To set the stage, we must first point out an important factor about the Dow Industrials and S&P 500 that contributes to their ability to reach new highs.

First, the Dow Jones Industrial Average is what is considered to be a price-weighted index.  According to Investopdia.com, a price weighted-index is:

“A stock index in which each stock influences the index in proportion to its price per share. The value of the index is generated by adding the prices of each of the stocks in the index and dividing them by the total number of stocks. Stocks with a higher price will be given more weight and, therefore, will have a greater influence over the performance of the index.” (read more here)

Next is the S&P 500.  The S&P 500 is a capitalization-weighted index.  Again, referring back to Investopedia.com, a market-cap weighted index is:

“A type of market index whose individual components are weighted according to their market capitalization, so that larger components carry a larger percentage weighting. The value of a capitalization-weighted index can be computed by adding up the collective market capitalizations of its members and dividing it by the number of securities in the index.” (read more here)

Each of these indexes are biased in the way they reflect the overall market movement.  In the case of the Dow Jones Industrial Average, it is biased towards the highest priced members while the S&P 500 is tilted to the stocks that are similarly expensive, on a market-cap basis.  In order to get a true sense of how all of the stocks are faring, rather than a select few that have been favored by investors, it is best to track a broadly based “equal-weighted” stock index.  According to Investopedia.com, an equal-weighted stock index  is:

“A type of weighting that gives the same weight, or importance, to each stock in a portfolio or index fund. The smallest companies are given equal weight to the largest companies in an equal-weight index fund or portfolio. This allows all of the companies to be considered on an even playing field.” (read more here)

For the most part, an equal-weighted index reflects how all stocks have fared in a bull or bear market.  This is important because it allows for greater insight into where we are and potentially where we might be going.  One equal weighted index of over 1,700 companies that has been around since 1962 is the Value Line Geometric Index (found here).  In the chart below, we have compared the market action of the Value Line Geometric Index over a ten year period from 1962-1972 and 2002-2012.

Value Line Geometric

What should stand out the most between both charts is the fact that, according to the Value Line Geometric Index, while the general indexes like the S&P 500 and Dow Jones Industrial Average are making new highs, the majority of stocks have not participated in the rise.  In addition to not exceeding the peaks of 1968-1969 and 2007, the inability to exceed the 2011 highs is an indication of significant resistance as was experienced in 1971 and 1972 peaks.

Adding to our concern about the lack of participation by the broader stock market is the divergence between the Dow Jones Transportation Average and the Dow Jones Industrial Average since February 2012 (found here).  This divergence can also be found in the chart below in the period from April 6, 1972 to January 5, 1973 between the Transports and Industrials.  The declines that followed the divergence and peak of ‘72-‘73 were -59% and –44% for the Transports and Industrials, respectively.

DT '72

Until the Dow Theory divergence is resolved and the Value Line Geometric Index make new highs above the 2011 and 2007 peaks, we’re concerned that the stock market is skating on thin ice.

Dow Theory: Non-Confirmation

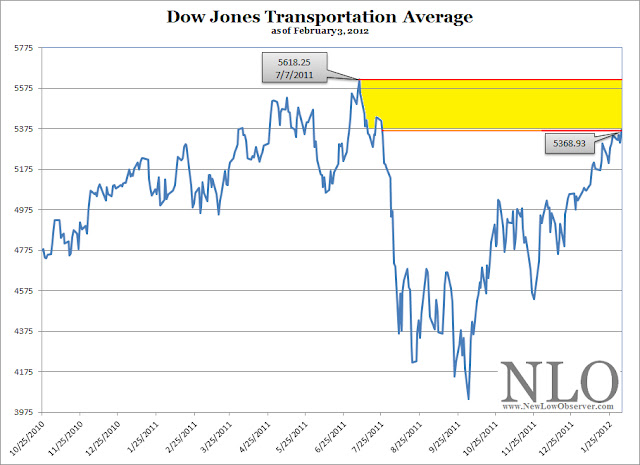
On February 3, 2012, the Dow Industrial Average made a new all time high since the low of March 2009.  All that is needed in order to achieve a confirmation of the upward trend is for the Dow Jones Transportation Average to exceed the July 7, 2011 high of 5,618.25.
There is a marginal difference of 4.64% between the Dow Transports high and the current level.  We're anxiously waiting to see if this gap can be closed with conviction in a relatively short period of time.  So far, every day that the Dow Industrials makes a new high with the Dow Transports below the previous high is considered a Dow Theory non-confirmation which reinforces the bear market thesis.

Dow Theory: Non-Confirmation Looms

Review

·        On August2, 2011, Dow Theory indicated that the market was headed lower.  At that time we posted an article to indicatethat the bull market run from March 9, 2009 was over.
·        OnAugust 8, 2011, all indications were that the stock market had reached a pointwhere we could estimate the upside targets or bear market rally targets.  On August9, 2011, we said the bottom had been established and that the direction washigher.  We missed the actual marketbottom by 1.42%.  We also indicated thata renewed bull market could not be considered until the old highs, set in 2011,were exceeded.
·      On October15, 2011, we said that “…the indexeswill at least rise to the July highs [DJI-12,724/DJT-5,618] and maybe even the April 2011 highs [DJI-12,807/DJT-5,527].” With this in mind we said, “The coming market volatility will providegreat opportunities for traders and allow investors a chance to cash out ofotherwise undesirable positions and take profits. 
Dow Theory: February1, 2012
Today’smarket activity has the Dow Jones Industrial Average trading as high as 12,784.62and the Dow Jones Transportation Average trading as high as 5,374.81.  While the Dow Industrials are knocking on thedoor of the July 2011 high of 12,807, the Dow Transports appear to be far fromconfirming the generally bullish market direction.  However, keep in mind that the Transportstypically jump by a greater percentage day-to-day than the Industrials so itwould not be unexpected to see the Transports potentially give a bullishconfirmation from its current level.
Leavingaside the prospect that the Industrials and Transports may give a Dow Theorybull market signal, we’re still in a bear market.  Also, we have our reservations about arenewed bull market indication, when and if it comes.  After all, the Transportation Index havetypically led the way in terms of where the general market is headed.
Throughoutthe bull market run from March 9, 2009 until August 2, 2011, the TransportationAverage continually led the market higher and refused to confirm on thedownside.  Now that we’re currently in abear market, our view is best represented in the quote from our April6, 2011 comment, “what we see fromthe Transports on the way up we may also see on the way down.
Combinedwith the fact that we are already in a bear market and potentially faced withthe downside pressure of the second half of a 4-year cycle as indicated in our January10, 2012 posting and you’ve got the recipe for a classic Dow Theorynon-confirmation of a bull market.
ThePunchline: Be on the lookout for the Dow Industrials (12,807.51) and DowTransports (5,618.25) to jointly exceed their 2011 highs.  If either index cannot go above theirrespective 2011 high, then we have to assume that the bear market still rules.  If a bear market rules, from such aprecarious height, then it would be worth re-considering any new investments atthis time.

Dow Theory

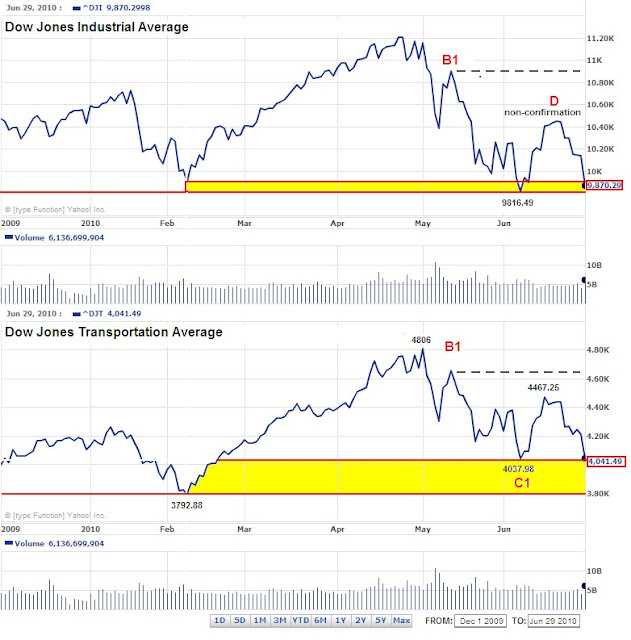
The markets are getting very close to giving us the Dow Theory indication that we need to exit a majority of our positions. Today (June 29, 2010), the Dow Jones Industrial Average closed at 9870.29 which is 53.80 points above the June 7, 2010 of 9816.49. Falling below 9816.49 would be one half of the bear market signal needed to indicate that the market will fall precipitously.

To make matters worse, the Dow Jones Transportation Index closed down today nearly twice as much as the Industrial Index. This indicates that there is significant selling interest. This doesn’t bode well for the Transports because in order to trigger the second half of the bear market signal the index would only have to fall 248.61 points. After today’s decline of 169.52 points in a single day, the remaining 79.09 points needed would not be all that difficult to come by.
The chart below displays a critical reason why I would be bearish on the market at this time. The dashed black line extending from B1 was supposed to be the upside target from point C1 in our last Dow Theory article. However, neither the Industrials nor the Transports were able to come close enough to be misinterpreted as an indication that the bull market run was likely to continue. The inability of the market to breach point B1 was a major non-confirmation according to Dow Theory.
Finally, any simultaneous declines of the Industrials and Transports below the yellow zones on a closing basis would tell us for certain that the bull market has run its course and that an additional correction of 15% on the Dow Jones Industrial Average is likely.

We’re being generous by not considering the June 7th lows for both indexes as the critical points for a bear market indication. For some Dow Theorists, waiting for the Transports low on February 5th is akin to playing with fire. However, we must adhere to the extremes to ensure quality buy and sell signals.

The only holdout is that either the Transportation Index or the Industrial Index gives us a downside non-confirmation by not going below the Feb. 5th or the June 7th lows, respectively. If we get a downside non-confirmation then we will consider selling a small portion of the portfolio on any strength.

Dow Theory

On October 16, 2009, I wrote an article on SeekingAlpha.com titled “Stock Market Projections,” where I attempted to predict the next low point for the Dow Industrials. In that article I said:
After I ran the numbers, the cycle analysis method indicates that from January 24, 2010 to February 15, 2010 is the next expected low.”
Eerily, the Dow Jones Industrial Average has managed to hit a major low on February 8, 2010. This is almost exactly in the middle of the range where, based on cycle analysis, the Industrials were expected to go. At the time it was my assertion that after hitting the low in February 2010 we could expect that the next move upwards would be to the 12,000 level.
The case for the move upward has been bolstered by the fact that, according to Dow Theory, the Industrials and the Transports have exceeded their January 2010 highs based on the closing price of March 18, 2010. However, as the Industrials have exceeded their March 18th closing price the Transports have not followed through so far.  This type of divergence between the two indexes is generally considered to be a non-confirmation.
The great Dow Theorist Richard Russell (Dow Theory Letters) has spoken at length about non-confirmations in the indexes and how to interpret the trend of the market in this context. According to Russell:
"It is a reasonable practice in areas of non-confirmation or divergence to give precedence to the primary direction. Thus, after a rally in a bear market, when one Average refuses to confirm the other on the upside, the strong presumption is that the next direction of the market will be down. More positive proof is provided if the two Averages then retreat below previous minor decline lows. The converse of this is true in a bull market, and many impressive advances have been “tipped-off” in areas where one Average refused to follow (confirm) the other through an important low point."
Richard Russell, Dow Theory Letters, Issue 102, May 2, 1960, page 2. www.dowtheoryletters.com
We would not be totally satisfied with the bull market indication (within a secular bear market) until the Transportation Index is able to go above 4422.50. However, until that time, we would consider this a bull market that is waiting for a confirmation rather than a potential bear market in the making. While we’re still sticking to a projected Dow Industrials of 12,000, the market has seemed to run out of the explosive bursts on the upside that it once had. Despite this concern, we wouldn’t be surprised of the market truly melted up from the current level.
  • The article on Seeking Alpha titled “Stock Market Projections” is here.
  • For better viewing, the chart in the article is here

Email our team here.

Dow Theory

Although the markets have been relatively quiet in the last few weeks, according to Dow Theory, the Dow Jones Industrials Average and the Dow Jones Transports Average have been demonstrating classic conditions that would allow us to determine if the market will continue beyond the prior highs set in January or continue lower.
The Dow Jones Industrial Average is the measure by which everyone gauges “the market.” In the chart below, since the January 19th peak of the Industrials, the market declined until the February 8th bottom. After February 8th, the Industrials managed to exceed the rally high of 10,296.84. By exceeding the high of 10,296.84 and the 50% level of 10,368.83, the Industrials have demonstrated a bias towards going higher rather than lower.
For the Dow Jones Transportation Average, the peak of January 11th and the trough of February 8th gave us a decline of 469.97 points or 11.02%. When the index bottomed on February 8th, it was able to exceed the 3993.12 level, which is a classic Dow Theory indication that the index is going back to the old high of 4262.85. Ideally, in the chart below, if the index could stay above the 50% level (red horizontal line) and finally the 3993.12 (blue horizontal line) then we could expect the Transports to go back to the old high and possibly beyond 4262.85.
In order for Dow Theory to work, we need both the Industrials and the Transports to confirm the action of each other. So far, we’ve seen the Industrials confirm the decline started by the Transports on January 11th with a declining pattern on January 19th. After both indexes started trending downwards they both had significant rallies within the downward trend, which peaked at 10,296.84 and 3993.12. Both indexes bottomed on February 8th and moved above the rallying peaks and the 50% ranges within the previous downward trends. All of these confirming moves point to the prospect of a higher market.
The only holdout is that the Industrials went lower today (Feb. 22nd) while the Transports continued higher. From my experience, since the bottom in March 2009, I have noted that the Transports have led the way with the Industrials ultimately confirming the direction. However, this current move down, by the Industrials, while the Transports moved higher has to be taken into consideration. Any non-confirmation could lead to a major change in the trend.
The Industrials now need to stay above either the 10,368.83 or 10,296.84 while at the same time going above 10,402.34 in order to confirm the Transports’ move higher today. Alternatively, if the Industrials break down from here, falling below the 50% and rally peaks, then the Transports should follow in a similar fashion.
It should be noted that the current market action is dancing around my calculations of 10,302 being the 50% level for the Dow Industrials peak of October 2007 and the trough of March 2009 as indicated in my May 2009 posting. It is not surprising that we’re witnessing listless market action at this time. Market participants large and small are deciding if they should capitulate to the trends since March 9, 2009 or get out at a theoretical break-even point. Remember, the 50% level of the previous decline is an approximation of the average price paid by a majority of the current market participants. Is there enough momentum to keep the market going higher? Since March 9, 2009 the Transports have told us the answer to this question. We’ll have to see if this continues to be the case going forward.
-Touc

Dow Theory

In reading The Stock Market Barometer by William Peter Hamilton, I find that there is significant contribution to the topic of Dow Theory. It is Hamilton’s book that led to the even better The Dow Theory and Dow’s Theory Applied to Business and Banking by Robert Rhea. One area of contention is my belief that Charles H. Dow was absolutely right about double tops and double bottoms. Hamilton, in reference to double tops and double bottoms, says:

“In the same editorial (Wall Street Journal, 1/4/1902) Dow goes on to give a useful definition from which legitimate inferences may drawn. He says: ...

‘It is a bull period as long as the average of one high point exceeds that of previous high points. It is a bear period when the low point becomes lower than the previous low points. It is often difficult to judge whether the end of an advance has come because the movement of prices is that which would occur if the main tendency had changed. Yet, it may only be an unusually pronounced secondary movement.’

This passage contains, by implication, both the idea of ‘double tops’ and ‘double bottoms’ (which I frankly confess I have not found essential or greatly useful) and the idea of a ‘line,’ as shown in the narrow fluctuation of the averages over a recognized period, necessarily one either of accumulation or distribution.”

Hamilton, William Peter. Stock Market Barometer. Harper and Brothers. 1922. page 32.

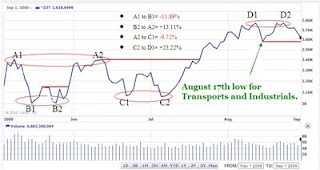
In my May 15, 2009 article, I pointed out how important double tops and double bottoms have played a role in defining the direction of the Industrials and Transports. So important is the role of double tops and double bottoms that they have accounted for 72% of the major bull and bear moves in the stock market. The current market action, since May 1st, has been in favor of double tops and bottoms in the Transports index portending the change in the market direction in the intermediate term.

As you can see from the chart below, there have been two double tops and two double bottoms. So far, both double bottoms (B and C) and one double top (A) have been followed by sizable moves in the Transportation and Industrial index.

Currently, we're faced with the double top indicated as D1 and D2. From what I can tell, if the decline from D2 goes any further below the August 17th low then we may retrace up to 75% of the gains from C2 to D1. This assessment is based on the prior correction of A2 to C1 from the rise of B2 to A2. On the way down to C2 there are smaller support levels however their significance is not as pronounced as the percentage change from A2 to C1. We should assume the worst case scenario and expect that the Transports will go to 3239.36. Falling to points C1 and B1 would be the next order of operation.

Interestingly, Charles H. Dow says that the action of double tops and double bottoms is most commonly associated with market manipulation. In Hamilton's Stock Market Barometer there is a July 20, 1901 Wall Street Journal excerpt where Dow says:

"Another method [for detecting manipulation] is what is called the theory of double tops. Records of trading show that in many cases when a stock reaches top it will have a moderate decline and then go back again to near the highest figures. If after such a move, the price again recedes, it is liable to decline some distance."

Hamilton, William Peter. Stock Market Barometer. Harper and Brothers. 1922. page 36.

The method described by Dow is commonly executed by institutions and other large money interests. The term that is most often used today is called a trial balloon. If successful, the money interests can gauge small investors willingness to sell or buy stocks and then execute a bull or bear raid. Today, it would seem unheard of for the editor of the Wall Street Journal to suggest there is manipulation and then go so far as tell how to detect it. And yet, the words of Charles H. Dow ring true today as they did in early 1900.

Note: On August 25th I said that the great Dow Theorist Richard Russell was wrong about his call of a new or renewed bull market. Well, after placing a call to Russell and talking to his staff the bull market indication was taken away the very next day and a non-confirmation was iterated. I'm sure that Mr. Russell got many calls on that error so I don't think that I swayed him personally (though I'd love to think that I did.)

My goal wasn't to have the bull market indication taken away, instead it was to demonstrate that a non-confirmation needed to be worked through. For this reason I still stand by my belief that the bullish move (within the context of secular bear market) from the March 9th low isn't over unless we resolutely pierce the 8146 level on the Dow Industrials. Touc.


Please revisit Dividend Inc. for editing and revisions to this post.