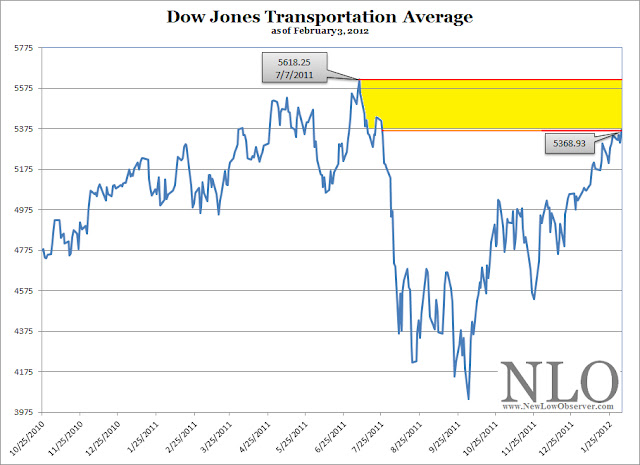
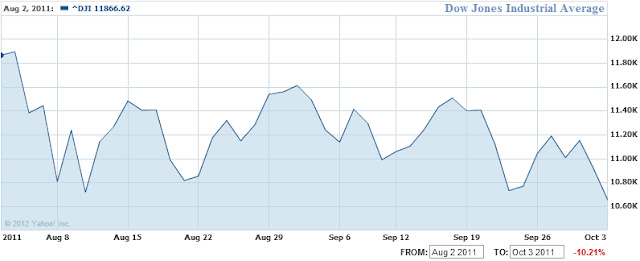
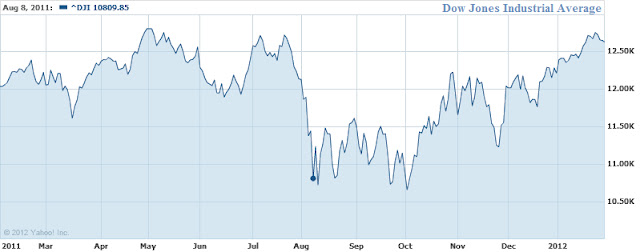
It appears that Dow Theory is not understood, by even the best in the industry. In an article titled “The Meaning of the Transports’ Weakness,” Mark Hulbert surveyed some of the industry’s best Dow Theorists for a clue as to what the market was expected to do next. What stands out in this article is the following remark:
“Frustratingly, not all Dow Theorists agree on an answer. In fact, two of the three monitored by the Hulbert Financial Digest — Jack Schannep of TheDowtheory.com and Richard Moroney of Dow Theory Forecasts — think the appropriate point of comparison is not last summer but late October. And because, near the end of December, the Dow averages rose above their late-October highs, both Schannep and Moroney believe that the Dow Theory is solidly in the bullish camp — notwithstanding where the Dow transports might be relative to their July high.”
Within this commentary is a revealing explanation as to the reason why we believe that Schannep and Moroney got it wrong, thereby issuing a bear market indication in August 2011 and a bull market indication in late December 2011. In order to understand this, we must first point out a diagram of how Dow Theory reversals typically occur.
Courtesy of Richard Russell’s Dow Theory Letters (www.dowtheoryletters.com), Figure 1a and Figure 1b show how the Industrials and Transports need to retest prior lows established at point A. This retesting of the prior low would come after a medium-term rise at point B. Once the market rests the prior low, the market would then need to exceed the medium-term high of point B.
With the diagram above, we can now see how Schannep and Moroney could have considered that a new bull market was in the making. Once the market exceeded what they believed to be the POINT B in figure 1a and 1b, it then appeared to be a new bull market. Unfortunately, while the Dow Industrials appeared to follow the script in Figure 1a, the Transports were far behind in providing a similar pattern of retesting the previous low. This error led to an incorrect assessment of a new bull market.
Interestingly, Schannep and Moroney were inaccurate even in their call of a “bull market” using Dow Theory. Based on the diagrams of figure 1, a new bull market should have been indicated in early October instead of late December. In the chart below, it should be noted that the false bull market indication in October had much more to gain than the late December indication. Worse still, only a month later, in February 2012, the Dow Transportation Average starts to diverge from the path of the Dow Jones Industrial Average.
The current divergence between the Industrials and Transports is a confirmation of the bear market trend. Additionally, we expected that the Industrials and Transports are going to re-test the lows of 2011. However, our suspicion is that both the Transports and Industrials will sink below the 2011 lows and possibly go strait to the 9,700 level on the Industrials. The prospect remains that the bear market could potentially end if the Transports retest the lows of 2011 without falling significantly below.
As early as October 15, 2011 (article here), we indicated that the “…coming market volatility will provide great opportunities for traders and allow investors a chance to cash out of otherwise undesirable positions and take profits. Our expectation is that the Dow will go to the July 2011 highs before struggling at the May 2011 highs. Again, we’re still in a cyclical bear market until the Transports and Industrials exceed their respective 2011 highs.”
We hope that our readers have benefitted from our advice to unload undesirable positions.
Best regards.


