Category Archives: Edson Gould

Precious Metals Follow-Up

Silver

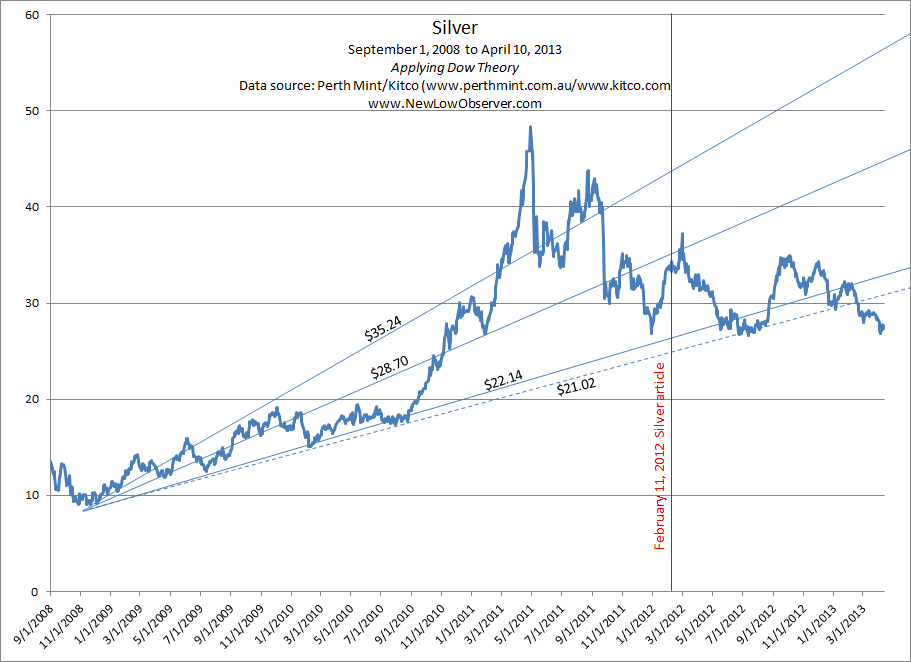
On February 11, 2012, we wrote a piece on Silver and SLV titled “Correction of Errors on iShares Silver Trust (SLV) Interpretation” (found here). In that article, we said the following:

“The current indications suggest that SLV will fall as [low as] the $22.14 support level. Because silver easily fell to the third support level in the period from 2001 to 2008 (within the context of a precious metal bull market), we expect that the $21.02 is a realistic worst case scenario to watch for. We will consider buying silver and related derivatives at $22.25 and below.

“We view the most recent rise from the December 2011 low as running out of steam.Therefore, the rising resistance level established at $28.70 appears to be firmly in place…for now.”

As seen in the chart below, Silver has declined to the rising support level of $21.02 in many instances but broke through to the downside on February 18, 2013.

Silver 4-10-2013

From a technical standpoint, the next downside target for silver may be to the $20 level if the current levels don’t hold. However, under typical circumstances, any point below the $21.02 level is considered undervalued. While it is possible that Silver could fall further we don’t play the short side since we’re in the position to accumulate good values. Values at this point trump the guesswork of when to enter and exit the short. We believe that anyone interested in the upside potential to silver should thoughtfully accept the potential loss of –50% or more and purchase in two stages, once at a predetermine price at or below the current level and a second time at or below the first purchase.

Agnico-Eagle Mines (AEM)

On April 6, 2012, we recommended the consideration of Agnico-Eagle Mines (AEM) (found here). On September 25, 2012, we recommended selling of AEM (found here). While we got a lot of heat from readers of the SELL recommendation, from the less than brilliant to the reasonably rational, our work has proven that precious metal bull markets are vicious and should not be taken lightly.

After our recommendation of AEM on April 6, 2012, the stock rose nearly +40%. When we gave the sell recommendation of AEM on September 25, 2012, the stock increased an additional +11%. However, as of April 12, 2013, AEM is down –27% from our sell recommendation and down –37% from the November 2012 high at $57.33.

image

Never under-estimate the power of a gold bull market. We hope that our work on this topic has been instructive.

Bitcoin Downside Targets

After seeing a discussion of Bitcoin on Bloomberg (found here) we decided to run Edson Gould’s Speed Resistance Lines (SRL) on the “currency.”

image

The most important feature regarding this SRL analysis is precedence.  Without precedence we could not ascribe any amount of confidence to what is in the chart.  Of course, the precedent that we’re referring to is the peak in the price near June 2011.  At that time the peak price was $31.90.  Based on the SRL for that period, the conservative downside target was $17.24 and the extreme downside target was $10.36.  In each case the price of Bitcoin declined below both level and on a resounding basis.  The ultimate low after that parabolic peak was $2.30 in late December 2011, a decline of -92.78% from the peak.

Because the nature of parabolic peaks is to crash disastrously explains why the more moderate peaks of January 2012 and July 2012 did not give up more than 66% of the previous increase.  The current parabolic increase in Bitcoin has a conservative downside target of $89.45 and an extreme downside target of $76.05.  However, if Bitcoin were to experience a -92% decline as it had done in 2011 then there is the potential for a decline as low as $16.45 which is slightly below the technical base of $21.10.

While technical analysis is considered voo-doo at best, we are trying to determine the limits of Edson Gould’s SRL.  So far, Gould’s SRLs have given accurate downside targets for Apple (AAPL), Green Mountain Coffee Roasters (GMCR), Herbalife (HLF), Chesapeake  Energy (CHK), BMC Software (BMC) and Silver or iShares Silver (SLV).  This is 54% of all the SRLs done on our site.  There are two SRLs that are still on their way to providing an accurate downside target and that is Randgold (RGLD) and Philadelphia Gold and Silver Stock Index (XAU), 18% of the SRLs run.  Twenty-seven percent of SRLs that have failed are Priceline (PCLN), Chipotle Mexican Grill (CMG) and Clean Harbors (CLH).  All of the SRLs and their success and failure can be (found here).

Note: Diamond Foods (DMND) has been excluded from the SRL count since DMND was done after the downside targets were achieved.

Downside Targets for Gold

The prevailing controversy, among gold bugs, is whether or not gold stocks have bottomed.  As our Gold Stock Indicator has indicated, so far, gold stocks have a long way to go before reaching lows similar to what occurred in 2008, on a relative basis.  This debate about gold stocks only arise out of the fact that they have fallen so much while the price of gold has been “stable.”

Continue reading

Technical Review: Carbo Ceramics (CRR)

Carbo Ceramics (CRR) was one of the companies that appeared at the top of our dividend watch list for many weeks beginning in February 2012. The watch list served as a beginning point for our research and we took a position in August (found here) at $65.02 (green arrow on chart below). Within three months, we saw shares of CRR rally to $74, a +13.8% gain. As such, we ‘hedged’ our position by selling the principal (found here) and let the profit run (red arrow on chart below).

Recent activity in Carbo Ceramics price suggests that, on a technical basis, the decline is over. Though a rally to its intraday peak of $180 is not expected, we believed there is a good opportunity for those interested in a short to medium-term speculative position in the stock.

image

In our view, the biggest bull case, on a technical basis, is that the 50-day moving average has crossed above the 150-day moving average creating what some call a "golden cross." We rely on the 150-day versus the more popular 200-day moving average for the fact that it is the road less traveled and provides an indication ahead of the crowd.

Currently, shares of Carbo Ceramics are trading just above the 50-day moving average, making this an ideal short-term transaction. For those who wish to trade this generally significant technical pattern, we’d consider selling if shares close below the 150-day moving average or if the stock gains +10% or more.

From a fundamental standpoint, Carbo Ceramics (CRR) provides long-term holders of the stock with the following attributes:

  • According to Value Line Investment Survey, the fair value for CRR is 14 times 2012 cash flow of $6.50, or a stock price of $91, a gain of +14% above the current price of $79.64. As an alternative, if the estimates by Value Line are correct, the 2013 fair value figure is $100.10, a potential gain of +25.69%.
  • Value Line indicates that Carbo Ceramics has increased the dividend for 12 consecutive years in a row.
  • Carbo Ceramics book value has had an annualized growth rate of +14.73%.
  • Carbo Ceramics has no debt

What Is the Downside Risk If I Want to Hold CRR for the Long-Term?

Dow Theory has the following downside targets for Carbo Ceramics:

  • $61.34
  • $44.39
  • $27.43

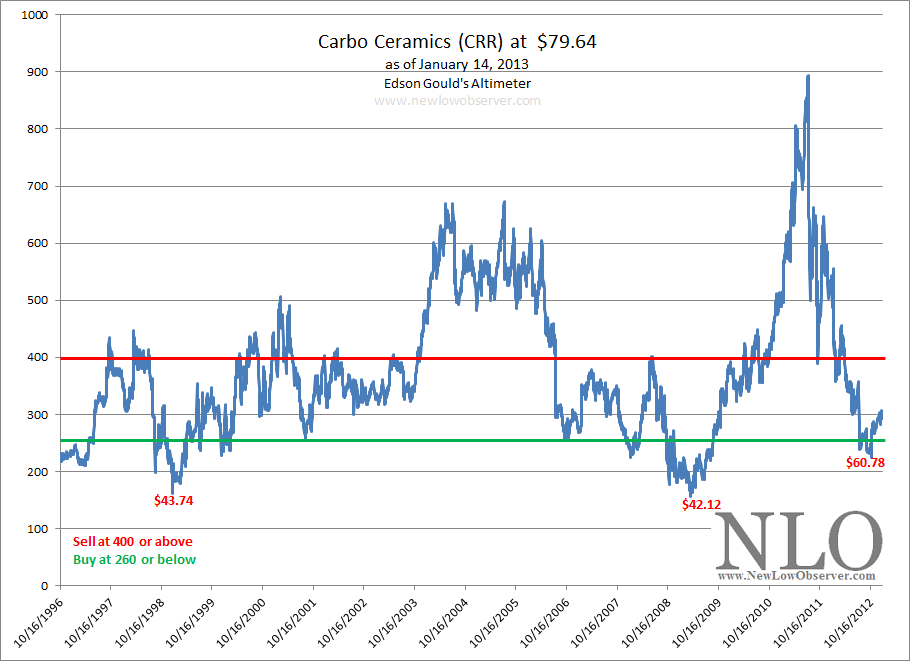
Based on the work of Edson Gould, Carbo Ceramics has the following Altimeter:

CRR 1-14-2013

Carbo Ceramics would have to fall to $70.20 in order to be considered a buy using the Altimeter above. However, as has been the case in the past, seldom does the Altimeter decline to the buy level and then immediately reverse to the upside. therefore we’d expect a push below the $70.20 level for good measure.

image

Edson Gould’s Speed Resistance Lines have $65 as the downside support level.

The most conservative of the three downside targets mentioned above is the Dow Theory level of $61. This seems be the most appropriate level to consider a first, or second, purchase if the desire is to hold Carbo Ceramics for the long-term.

Review: Green Mountain Coffee Roasters

This is a follow-up to our May 2, 2012 piece on downside and upside targets for Green Mountain Coffee Roasters (GMCR).

At the time, GMCR had traded as low as $28.50 (-38.9%)  in after-hours trading.  We gave a downside target of $22.53 due to the fact that the stock had declined below our projected support level of $37.21, as indicated on October 25, 2011.  Since our May 2, 2012 article, GMCR has declined as low as $17.11, see chart below.

Continue reading

Review: Netflix and Herbalife

Netflix (NFLX) is the first stock under review.  Our prior work on this stock can be found here (September 22, 2011).

Continue reading

Pan American Silver (PAAS): A Speculation in Silver?

Continue reading

What is Next for Herbalife (HLF)?

On May 2, 2012, Herbalife’s (HLF) stock price closed at $51.71.  At that time, we ran Edson Gould’s Speed Resistance Lines [SRL] to determine what the potential downside price would be (found here).  We determined that the conservative downside target was $45.45 and the extreme downside target was $24.33. 

On December 21, 2012, Herbalife (HLF) has managed to exceed our expectations by falling through the conservative downside target of $45.45 and within 11% of the extreme downside target of $24.33 by closing at $27.27.  The total decline since May 2, 2012 has been –47.26%.

Now we’re ready to re-examine what the prospects are for HLF based on the updated market activity.

image

At the current price of $27.27, HLF has fallen below the ascending extreme downside target of $24.33.   This suggests that a $24.33 handle on this stock is almost guaranteed on an intra-day basis, at minimum. 

After reaching the inevitable low in the current decline, we expect HLF to increase at least +30%.  If $24.33 were the low, then rising to $31.63 would not be out of the question.  This would be similar to the rise of the stock price from the May 2012 low to the late July 2012 high.  However, rising above the ascending $34.89 line (now at $41; ± $3-$4) could be a point where the stock price could stall and then decline dramatically.  In order for us to feel that the rise in HLF is sustainable, we’d like to see the stock rise, at minimum, above the $50.14 level based on Dow’s Theory.

Aside from declining to the $24.33 price, we’re concerned that if the $21.12 price is broken to the downside then HLF might retest the 2009 low of $6-$7 range.  Because the single digit numbers are so extreme, we’d opt to split the difference and say that the potential downside target below $21.12 is $14.06.

Note: Any money committed to HLF, either long or short, should be considered a speculation. This piece is a continuation of the examination of Edson Gould’s speed resistance lines as explained in prior articles (found here). This is not an endorsement to sell short at the current levels nor buy these stocks once falling below the extreme downside targets.

CMG Conservative Support Broken, Is $146 Next?

Today Chipotle Mexican Grill (CMG) broke below our conservative downside target support level.  Our downside target for Chipotle is based on Edson Gould’s Speed Resistance Line [SRL] and was initially constructed in our October 25, 2011 article (found here).  In that article, we arrived at a conservative downside target of $200.59.  However, as the price of the stock roses it became necessary to revise the downside target.  A revision of the conservative and extreme downside targets was done on October 6, 2012 (found here).

The chart below graphically represents what we believe is likely to transpire in the short-term:

image

It appears that CMG will decline to $233.23 with a high level of certainty and potentially to the $200 support level as was initially  indicated in our very first SRL analysis done on October 25, 2011.  The only remaining question is whether or not CMG will fall to our extreme downside targets as NFLX and GMCR did when we constructed SRLs for those stocks.

Our extreme downside target of $146 is based on our October 6, 2012 CMG revised target as seen in the chart below:

image

Procter & Gamble: If Overvalued, When Should You Buy?

We read a great article by Vince Martin titled “Procter & Gamble Is Severely Overvalued” (found here).  Martin went through a detailed analysis of the reasons why Procter & Gamble (PG) should be considered an overvalued stock.  Because Martin did not mention selling the stock (a cardinal sin of dividend investors), given such a strongly titled article, we thought we’d try to estimate what the downside risk for PG might be so that investors could prepare for when to buy the stock.

Keep in mind that as of October 12, 2012, Procter & Gamble (PG) has a price chart with the following activity since early 2007:

image

Overall, the price of PG has vacillated widely with a high of $74.67 and a low of $44.18.  Dow Theory suggests that the midpoint of such a range is the dividing line between a stock that is bullish or bearish.  In this case, the midpoint is $59.43.  As can be seen by the rise from the 2009 low, PG has found significant support at or near the $59 level.  This suggests that there is a bullish bias for this stock as accumulation seems to occur just below $60.  Keep in mind that any significant decline below $59 is considered bearish and could be the beginning of a retest of the 2009 low.

Although the article noted above did not indicate that there was a specific downside target to “fair” valuation or undervaluation, we believe that such a point must exist.  So far, Dow Theory and price activity since 2010 suggests that a fair or undervaluation sits around the $57-$59 level.  However, when viewed from Edson Gould’s Altimeter, PG seems to be trading at the equivalent of 1991 prices as seen in the chart below:

image

Gould’s Altimeter indicates that based on the current dividend, provided there are no dividend increases going forward, PG is undervalued and has critical support at the $55 level.  Any further increases in the dividend will only increase the undervaluation of the PG profile.  For now, Edson Gould’s Altimeter confirms what Dow Theory seems to indicate and that is that at the $55-$59 range, Procter & Gamble should be aggressively accumulated.

Another area of concern is the dividend payout ratio.  According to the article mentioned above:

“Assuming that 2013 dividends are paid at 60 cents quarterly -- a 6.7% raise, lower than any hike in the past decade -- the dividend will have risen 50 percent from 2008 to 2013, a period over which earnings are expected to rise just 14 percent. That is simply not sustainable, and as a result, in fiscal 2013, PG's payout ratio will almost definitely surpass 60 percent. In fact, on a free cash flow basis, PG's payout ratio has already passed that level, jumping from 58 percent in FY2011 to nearly 66 percent in FY2012.”

At some point, the dividend payout ratio can become the Achilles’ heel for PG if earnings aren’t sustainable.  However, we believe that the earnings profile of PG will evolve and remain sustainable over time.  In fact, while Value Line Investment Survey confirms Martin’s expectation for an annual decrease in earnings of -8% for 2013, PG is projected to increase their earnings by +53% in 2015-2017, bringing the fair value estimate of the stock to $97.  This fair value estimate comes with a 100% “earnings predictability” rating from Value Line (dated 9/28/2012).

Obviously, anything can happen with a stock during such volatile times.  However, we believe that Procter & Gamble, while not cheap, is a reasonable stock to accumulate if an investor is looking for a 4 to 6-year holding period.  Aggressive accumulation of PG should take place if the stock declines to $59 and below.

Carbo Ceramics is Worth Considering Now

At the time that Carbo Ceramics (CRR) was trading at $82.79,  we said the following in our May 28, 2012 article (found here):

“Based on the current dividend for Carbo Ceramics, we have anticipated that the stock price will decline to $62.40 before the next buy indication is triggered.”

Interestingly, Carbo Ceramics fell as low as $62.41 on a closing basis on October 10, 2012.  Although this is one penny above the prior $62.40 buy indication, the recent increase of the dividend from $0.24 to $0.27 put the stock well within the buy range, as shown below.  Our estimate of $62.40 was based on Edson Gould’s Altimeter which has given reasonable buy and sell recommendations in the past.

image

As indicated in the chart, there are points where Carbo Ceramics has fallen well below the normal buy range.  On two prior occasions, Carbo Ceramics fell as low as the equivalent of today’s $43.74 and $42.12.  We are not putting it past this company to accomplish a similar decline this time around.  However, this is why we recommend the purchase of this stock in two phases.

image

When Edson Gould’s Speed Resistance Lines [SRL] are applied to Carbo Ceramics we can see that the stock has taken back a majority of the gains that have accrued from the 2008 low to the most recent peak.   The SRL indicates that the extreme downside target of $60.08 is about to be reached shortly.  However, there does exist the possibility of going back to point where CRR established its critical support at $26.51.

According to Dow Theory, Carbo Ceramics has the following downside targets:

  • $60.29
  • $43.40
  • $26.51

As indicated in our portfolio (found here), we have already completed the first of the two purchases for CRR and are waiting for either the price to rise to the sell range or decline to the $43.74 level before implementing the next purchase.  The sell range currently stands at $96.

Note: This stock is worth considering only with the appropriate amount of due diligence by confirming the fundamental attributes and proper consideration of the downside risk as indicated above.

Gold Stock Indicator

Based on our preliminary work, we believe that gold stocks, as represented by the Philadelphia Gold and Silver Stock Index, will reach our long-term gold stock sell indication between July 15, 2013 and November 25, 2013.

image
This is our best estimate based on the current trajectory of our Gold Stock Indicator. As we get closer to the dates, we will be better able to project the gold stock long-term sell indication with what we believe to be a certain level of accuracy.

This estimate is subject to change if the short-term gold stock buy indication (green diagonal line) is broken to the downside which would bring us back to the long-term gold stock buy indication. The scenario that could easily break the downside trendline is a general stock market decline.  Although Dow Theory indicates that this is a possibility, we're waiting for the appropriate confirmation either up or down. 

The best example of where the stock market is right now is reflected in the chart below, from our September 21, 2012 Dow Altimeter:

Royal Gold (RGLD) Speed Resistance Lines

In the chart below we’ve provided Edson Gould’s Speed Resistance Lines (SRL).

image

What is interesting about the above chart is the following:

  • Point A1 to point A2 declined –60%
  • Point B1 to point B2 declined –40%
  • Point C1 to point C2 is a projected decline of –55%

The SRL for Royal Gold at $44.62 doesn’t seem outlandish given what has already occurred in the previous declines from prior peaks.  The X marks the first decline after a “minor” parabolic move that was later exceeded on a larger scale to point A1, B1 and C1.  Additionally, the  X reflects the minimum retracement from the top and has provided consistent support for the price for RGLD.

We’d consider buying RGLD if it declines to either of the support levels of X3 or C2.  The movement of RGLD has been consistent with the price of gold (GLD) which is in stark contrast with gold stocks as represented by the Philadelphia Gold and Silver Stock Index (^XAU), as indicated in the chart below.

image

Edson Gould’s SRL: Chipotle Mexican Grill Downside Target Update

In a series of articles examining Edson Gould’s Speed Resistance Lines (SRL), we put some big name stocks to the test.  The test was to see if Gould’s SRL had any reasonable predictive ability to determine the downside targets for the stocks in question.  The results have been astounding and are well worth your careful consideration.

First, we will review the SRLs for Netflix (NFLX) and Green Mountain Coffee Roasters (GMCR) and the outcome of the analysis related to Gould’s indicator.  Next, we will review the updated Chipotle Mexican Grill (CMG) downside target.

The first stock that we applied the SRLs to was Netflix (NFLX) on December 3, 2010.  At that time, NFLX was trading at $205.90.  When the stock rose to the eventual peak of $298.73, we thought that maybe the SRL was a waste of effort.

However, almost one year to the day after we ran the SRL on Netflix, the stock had broke through our conservative downside target of $117.76.  Even more amazing, NFLX later declined below the extreme downside target that we set at $68.63.  Today Netflix trades at $66.56.  Because we’re not short-sellers, we did not take any position on the decline of the stock.  However, we were able to buy the stock at $62 and sell the stock at $100 in the subsequent rebound from the initial low.

The next stock that we applied the SRL to was Green Mountain Coffee Roasters (GMCR) in our October 25, 2011 review of Edson Gould’s formula.  At the time, GMCR was trading at $64.75 after declining –42% from the peak in the stock price on September 19, 2011.  There were some who said that the stock was a bargain and should be bought.  However, Gould’s SRL indicated that at minimum, GMCR was to decline to $59.93 and possibly decline to the $37.21 level.

In a May 2, 2012 revision of Gould’s SRL for Green Mountain Coffee Roasters (GMCR), when the stock was trading at $28.50, we suggested that the stock could trade down to $22.53 with and additional downside target of $8.30.  Today GMCR trades at $22.13 (see chart above).

In the same October 25, 2011 review of Green Mountain Coffee Roasters, we covered Chipotle Mexican Grill (CMG).  At that time, Gould’s indicator suggested that CMG had a conservative downside target of $200.59 and an extreme downside target of $114.16.  As we’ve indicated in the past, SRLs are based based on the highest price the stock attains. In this case, CMG rose as much as +45.70% since our October 25, 2011 article.  Below is the revised SRL for CMG.

image

Based on the high of $440.40, Chipotle Mexican Grill has a conservative downside target of $233.23 and an extreme downside target of $146.80.  We’re cautious about anyone who suggests that CMG is a “good buy” or “undervalued” at the current price. Already, we’re within striking distance of the $233.23 conservative downside target as CMG trades at $280.93 after hedge fund manager David Einhorn recently recommended selling the stock short (article found here).  If past use of SRL is any indication, when CMG declines below the upward trending conservative downside line, you can be assured that the stock will hit $233.

Again, our purpose of using SRLs to determine the downside risk of a stock that we’d like to buy but don’t want to chase.  We’re willing to wait for the eventual decline or admit that we missed the boat on a great investment opportunity.  Again, we don’t sell stocks short because we’re interested in acquiring great companies at the best price possible.

Disclaimer: This piece is a continuation of the examination of Edson Gould's speed resistance line as explained in prior articles. This is not an endorsement to sell short at the current levels nor buy these stocks once falling below the extreme downside targets since the stocks have been randomly selected, at best.

Dow Industrials Altimeter

Below is a chart of the Dow Jones Industrial Average Altimeter.  Our best interpretation of the current altimeter pattern is that the Dow Industrials need to exceed the previous high set in April of 2011 in order for us to feel that a new bull market has emerged.

image

As we’ve described before, the Altimeter reflects the relative value of a stock or index compared to the dividend that is paid.  Those interested in knowing what the dividend for the Dow Industrials is can find that information in Barron’s Market Laboratory section under Indexes’ P/Es & Yields (found here).

Surprisingly, the formation of the Dow Industrials Altimeter is exactly the same formation as the Value Line Geometric Index, as seen in the chart below:

image

In a previous article (found here), we talked about how the Value Line Geometric Index (VLIC) is an equal weighted index that reflects how all stocks are doing since the bull market began in the first quarter of 2009.  The fact that the Value Line Geometric Index has not achieve a new high suggests that there is limited participation by all stocks in the market. Therefore, confidence in new highs by large cap stocks, as reflected in the Dow Industrials and S&P 500, should not be trusted.

We believe that there is limited upside potential based on the Dow Theory non-confirmation (article found here) and the broader market as reflected in the VLIC Index.

Priceline.com (PCLN) Downside Targets

In after-hours trading, Priceline.com (PCLN) has decline below the June 1, 2012 support level of $610.50.  By declining below such a level, it appears that we can project downside targets using Edson Gould’s Speed Resistance Lines.

image

Our current assessment of Priceline.com is far different from our examination of Gould’s Speed Resistance Lines on November 10, 2011 (found here).  As the price of PCLN has increased so does the downside targets. 

Over the next several months, we’ll be able to see if Priceline.com declines to the conservative target of $434.73 and then to the $317 level.  Our extreme downside target of $258.32 appears as an outlier event at this point but will be reconsidered if PCLN declines to $317.