Category Archives: GME

Stock Short Interest Ratio

There is a lot of chatter around the Short Interest Ratio and we wanted to share some insight on this topic.

The excerpt below came from a great book by Harry D. Shultz - Bear Market Investing Strategies.

If we apply this logic to GameStop (GME), it was clearly a buy (in perfect hindsight) because the short percentage was 226% in in mid-January.

This is worth noting in the next short squeeze scenario.

GameStop (GME) – Are we really going to the moon ๐Ÿš€๐Ÿš€๐Ÿš€๐ŸŒ‘ ?

The rise, fall, and rise of GameStop (GME) is difficult to ignore. We find it extremely entertaining but also educational. As a result of this, we started looking at reversion to the mean which has produced some amazing charts.

Before we jump to GameStop $GME, we want to show you the same model applied to Bitcoin (BTC-USD). We have plotted out the chart of Bitcoin with the 200 simple moving average (SMA), and a 1x standard deviation band. The spiked in Bitcoin only managed to reach +300% above 200 SMA. This was the rise of Bitcoin to 20,000.

With this context, let's look at GameStop. As of the January 28, 2021 close, the stock was +2,670% above its 200 SMA.

While we are not experts in options trading, the pricing for these derivative is absolutely puzzling. On the day that GameStop is up +70%, the March 19, 2021 $10 Put rose +46%. This is an option to sell GameStop at $10, -97% from today's price, within 49 days. There were more than 4,000 contracts traded before 10am today.

This is truly remarkable and we are observing this on the sideline.

GameStop, Like Tilray, is Treading Familiar Territory

On September 13, 2018, we provided downside targets for Tilray when it was trading at $118. The downside targets, based on the work of Edson Gould, were:

  • $66.67 (conservative target)
  • $54.55 (mid-range target)
  • $42.42 (extreme target)

Because of the speculative activity in Tilray, we made a point of building downside targets for the stock if the price doubled to $236. At such a price, the downside targets were:

  • $102.92 (conservative target)
  • $90.79 (mid-range target)
  • $78.67 (extreme target)

The actual intraday high for Tilray was $300 on September 19, 2018.  This was a far cry above the initial trading price of $118 that the downside targets were constructed.

As seen in the chart below, the actual low has been $2.43 and Tilray currently languishes at a price of $16.80.

image

On January 19, 2021, we projected price targets for GameStop (GME) when the stock was quoted at $39.91.  At the time, the downside targets were:

  • $21.26 (conservative target)
  • $18.22 (mid-range target)
  • $15.17 (extreme target)

Since that article, GameStop has increased as high as $159.18. 

image

Given what weโ€™ve seen with Gouldโ€™s downside targets in the case of Tilray and other stocks, we still believe that the conservative downside target of $21.26 will be achieved.

Nasdaq 100 Watch List

Symbol Name Trade P/E EPS Yield P/B Pct from Yr Low
QCOM QUALCOMM 38.95 31.3 1.25 1.70% 3.1 9.84%
ERTS Electronic Arts Inc. 17.77 N/A -2.3 N/A 2.3 13.18%
GILD Gilead Sciences, Inc. 47.42 16.8 2.82 N/A 6.7 14.79%
FSLR First Solar, Inc. 115.5 15.4 7.53 N/A 3.6 17.04%
SRCL Stericycle, Inc. 54.49 26.9 2.03 N/A 5.5 18.56%
APOL Apollo Group, Inc. 63.02 15.2 4.16 N/A 6.8 19.38%
GENZ Genzyme 56.91 36.9 1.54 N/A 2 20.85%

Watch List Summary

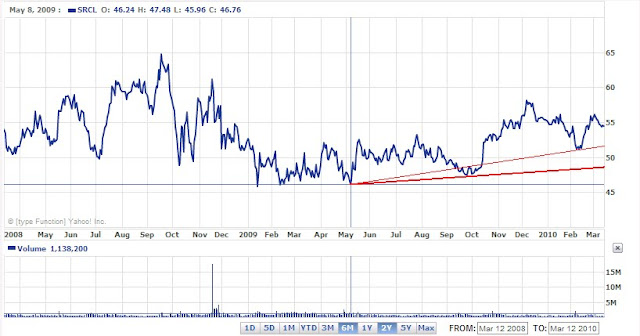
This week on the Nasdaq 100 Watch List there were several notable changes. We had Stericycle (SRCL) decline -1.55% for the week. Stericycle (SRCL) had the largest decline of stocks that were on our watch list from the prior week. It appears that SRCL is on its way to declining to the previous low of $50.62. Since May 2009, SRCL has managed to trace out higher lows. SRCL is currently selling 29% below the 10-year average P/E ratio and 24% below the 10-year average price to cash flow ratio. Counteracting those positive features is that the company is selling almost 7% above the 10-year average price to book ratio. According to Morningstar, SRCL is a wide moat company or a company that a significant advantage that is challenging for new competitors to enter the industry (SRCL chart below).

The leading stock on the Nasdaq 100 in the past week has been First Solar (FSLR), which gained 6.37%. FSLR is selling at least 60% below the 3-year average price to book, price to cash, price to earnings, and price to sales. Lacking any 10-year data on First Solar (FSLR) my intuition tells me to consider this stock only in a small portion of the portfolio and that Iโ€™m willing to lose 100% of invested funds. FSLR seems like the Whole Foods (WFMI) of the energy sector, great concept but little in the way of sustainability.
Finally, the sector that appears to be on the move is the video game group. Both Electronic Arts (ERTS) and Activision Blizzard (ATVI) gained 3.80% and 3.99% respectively. The move higher was also confirmed by Gamestop Corp (GME), which rose just over 6% for the week.
In a footnote to our Dividend Achiever Watch List, we wish to bring to your attention the recent rumors that SuperValu (SVU) is being considered as a takeover candidate. Since our Investment Observation on January 6, 2010, the stock has run up 33.72%. SuperValu (SVU) sports a price to earnings ratio of 38 and a price to sales ratio that is half of its 5-year average. The price to book ratio is currently at the 5-year average. SVU seems a bit rich for me at this time however the performance of the stock since our January 6th article does not surprise our team.
The Nasdaq 100 Watch List is strictly for the purpose of researching whether or not the companies have viable business models or are about to go out of business. These companies are deemed highly speculative unless otherwise noted.
 -Touc

Email our team here.