Category Archives: Gold Stock Indicator

Transaction Alert: Sold AEM & GFI, Bought NUGT

We have sold our positions in AEM and GFI and used the proceeds from those transactions to buy NUGT.  We sold both AEM and GFI at a loss of slightly more than -5%. We decided not to over-concentrate  in one sector by adding a third gold position.

We bought NUGT based on the dual (short and long-term) indication from our Gold Stock Indicator as indicated in our April 4, 2012 article (found here).

Our preference for using Direxion Gold Miners Bull (NUGT) and Direxion Gold Miners Bear (DUST) ETFs aren’t for the risk averse.  DUST and NUGT are speculative vehicles and not investments meant to be held on a long term basis.

Barrick Gold or Newmont Mining?: Edson Gould’s Altimeter Makes the Call

There are few times that we’ll actually recommend individual gold stocks because much of the available statistical data supports the view that gold stocks are inferior investments when compared to products like SPDR Gold Trust (GLD) or the iShares Silver Trust (SLV), let alone the peace of mind with ownership of the physical metals. The following are the three most prominent examples of when gold stocks didn’t make the grade.

First,  in the period from 1925 to 1932, a basket of gold stocks declined as much as  -64.81% when Homestake Mining is included in the index.  In a article titled “The Lessons of Homestake Mining in Gold Bull and Bear Markets,” we’ve outlined a majority of the reasons why Homestake did so well when other gold stocks didn’t. If we exclude Homestake Mining from the 1925-1932 period, gold stocks declined –76.47% in an equal-weighted gold stock index as reflected below.

image

Second, in the period from 1940 to 1960, although interest rates on the 10-year Treasury bond doubled from 2% to 4% and the 3-month Treasury bill increased nearly 800%, Barron’s Gold Stock Index was virtually unchanged in the same period of time.  Additionally, investors who feared “the coming inflation” and stayed out of general equities missed an inflation adjusted gain of  nearly 400% in the Dow Jones Industrial Average (DIA).

Third, in the middle of the raging gold bull market from 1971 to 1980, gold stocks routinely underperformed the price of gold.  In our articles on Seeking Alpha titled “A Strategy Is Needed for Lagging Gold Stocks” and “Why Gold Will Decline More Than the Markets,” we reviewed the instances where gold stocks routinely underperformed the price of gold or the stock market in general.  Worse still, Barron’s Gold Stock Index peaked in 1974 and declined -66% only to return to breakeven five years later, just before the blow-off stage in the gold bull market.  We can now add the selloff from July 2011 to April 2012 to the long list of severe underperformance of gold stocks, during a bull market in gold.

image

With the above facts in mind, it isn’t taken lightly that we would recommend gold stocks at this point.  However, a strategy is needed in order to outmaneuver the gold stock gremlins. In a recent Seeking Alpha instablog, we outlined the short and long-term gold stock price activity using our Gold Stock Indicator (found here) which is nearing a dual “buy” indication.

In our last article on gold stocks to consider, we used Edson Gould’s Altimeter highlighting Agnico-Eagle (AEM) and Gold Fields (GFI).  In this article we’re going to apply Gould’s Altimeter to Newmont Mining (NEM) and Barrick Gold Corp. (ABX). Gould’s Altimeter reflects the relative value of a stock based on the current dividend that is being paid.  Although Newmont Mining and Barrick Gold Corp. are near one year lows and have consistent dividend policies, Gould’s Altimeter sheds a completely different light on matters, leaving only one company a compelling investment opportunity after additional due diligence.

According to Yahoo!Finance, Newmont Mining engages “in the acquisition, exploration, and production of gold and copper properties. The company’s assets or operations are located in the United States, Australia, Peru, Indonesia, Ghana, New Zealand, and Mexico.”  There are a couple of fundamental attributes that are less than redeeming for Newmont Mining.  First, Newmont has a price to earnings ratio of 67.  This exceeds the norm for anyone who would buy a stock only if it had a p/e ratio of 20 or less.  The next issue is Newmont’s dividend which exceeds the trailing twelve months earnings by 91%.  This could be an issue down the road if earnings and the price of gold do not increase fast enough.

Considering these issues, Edson Gould’s Altimeter below suggests that, although the price of Newmont Mining (NEM) could decline from the current level, a purchase of the stock at or below $55 is considered a reasonable value.

image

The most impressive aspect of Edson Gould’s Altimeter for Newmont Mining is the period from 1996 to 2000 when the stock was in a clear downtrend during the entire time.  Despite this fact, the Altimeter gave clear indications of when Newmont was relatively “undervalued” (lowest trend line) and also overvalued (highest trend line).

The next stock is Barrick Gold Corp. (ABX).  According to Yahoo!Finance, Barrick Gold is involved in “…the production and sale of gold and copper. The company has a portfolio of 26 operating mines, and exploration and development projects located in North America, South America, the Australia Pacific region, and Africa.”  With Barrick’s earnings at $4.48 and a dividend of $0.60, the dividend payout ratio sits at a paltry 13.39% of earnings.

image 

However, the reduction of the dividend near the middle of 2010 has had a major impact on how the Altimeter reflects Barrick’s relative value, which has played out in the movement in the stock price.  Had the dividend not been cut, Barrick would be characterized as though it were undervalued at the current price.  However, based on the Altimeter, Barrick is considered to be on a declining trend until the Altimeter falls below the 119 level.

In this instance, Newmont has the redeeming attributes that should carry the price much further than Barrick Gold Corp. based on the Altimeters above.

Note: As a word of warning, anyone compelled to invest in Newmont Mining should be mindful of the periods when the Altimeter declines by a wide margin from the lowest trend line (green).  This suggest that, in the short term, there is considerable downside risk.  However, the data in the chart for each period assumes that an investor were to buy at the moment the Altimeter first crosses below the lowest declining trend line.

Gold Stock Indicator Points Up

Today at 12:10pm EST, our gold stock indicator signaled that gold stocks were reasonably undervalued.  This indication occurred just after the price of gold started a sharp rise in price today and just before gold stocks started to jump, as indicated in the intraday chart below:

image

  As indicated in our Transaction Alert today (April 10, 2012), we bought Newmont Mining (NEM) as a “long term” holding in gold stocks.  Our view of the long term is predicated on the percentage gain that is achieved and the alternative stocks that appear undervalued at the time.  If the gain has been exceptional in a reasonable period of time and there are better values elsewhere then we may jump ship.

Despite our confidence in the Gold Stock Indicator, we believe that it is necessary to have reasonable expectations for any of the stocks suggested. This means carefully examine the downside risk. As an example, it took Agnico-Eagle (AEM) a little over 1 year to achieve +174%. In that time, AEM traded in a narrow range for a majority of the time and fell almost -30% before reaching such astronomical heights.

Our purchase of the Direxion Daily Gold Miners Bull 3X Shares (NUGT) is strictly a speculation which we will sell soon after it has achieved a gain of +7.5%.  Our examination of 3x gold ETFs (DUST and NUGT) is that a gain of +7.5% is achieved 85% of the time, based on 80 transactions initiated by our Gold Stock Indicator since 1983.  Direxion’s DUST and NUGT ETFs are strictly for speculators (short-term) and should not be entered into for investment (long-term) purposes.  You have been warned.

Our last Gold Stock Indicator signal can be found here: Gold Stock Indicator Points Down

Gold Stocks to Consider Based on Our Indicator

In light of our Gold Stock Indicator approaching the long term buy signal (found here), we have decided to go over the gold stocks that pay a dividend and are near their respective 52-week lows.  In this review, we’re going to cover Agnico-Eagle Mines Ltd. (AEM) and Gold Fields Ltd. (GFI).  When, and if, the Gold Stock Indicator actually reaches the long term buy indication it will be posted to our site.  The stocks that we cover here are for you to do additional due diligence before taking any action.

Agnico-Eagle Mines Ltd. (AEM) closed at $32.37 on Thursday April 5, 2012.  Agnico-Eagle is currently operating at an annual loss of -$3.36 according to Yahoo!Finance.  Contributing factors to Agnico-Eagle’s decline in price over the last year has been problems with the operation of their mines.

As described in many of our previous articles, Edson Gould’s Altimeter is based on the stock’s price relative to the actual dividend paid.  The Altimeter is a critical real-time assessment of value based on the company’s dividend.  Below is the altimeter for Agnico-Eagle:

image

In our assessment of Agnico-Eagle, we have compared the current level of the Altimeter at 161.85 and compared it to other times when Agnico-Eagle has trade at the same relative level, or below, and traded up to 400 on the indicator.  In the case of Agnico-Eagle there were two periods, before the bull market in gold stocks began, that the stock was selling at a low and was a great buy (based on the altimeter).  In the period from November 2, 1990 to July 3, 1993, Agnico-Eagle rose +174% and in the period from August 25, 1998 to October 4, 1999 rose +157%.

Since the gold bull market began, the only other time that Agnico-Eagle was selling below 161.85 and subsequently traded up to the 400 level was the period from October 21, 2008 to October 6, 2010 for a gain of 103%, this far exceeded the gains of the SPDR Gold Shares (GLD) over the exact same period of time.

Next in our review is Gold Fields Ltd. (GFI).  Gold Fields sports trailing earnings of $1.22 in the last twelve months  and a dividend of $0.61 with a dividend yield of 4.70%.  Yahoo!Finance indicates that Gold Fields operates “in South Africa, Peru, Ghana, and Australia.” Based on the majority of countries that Gold Fields operates, there is some political risk to this investment.  However, Gold Fields has exhibited amazing consistency in the Altimeter below:

image

Presently, Gold Fields is trading at the Altimeter level of 42.38.  The chart depicts the times when GFI was bought at the 42.38 level and sold whenever the Altimeter reached 100.  The results are amazing and provide clear evidence on how gold stocks can outperform the price of gold when combining Edson Gould’s Altimeter with our Gold Stock Indicator.

Our approach to buying these stocks is to purchase in two stages, once at, or near, current levels and a second time only if the stocks fall -20% below the initial purchase price.  As an example, if we have $10,000 that we’d like to invest then we buy $5,000 now and hold the remaining funds unless/until the stock declines by -20%.  We’re basically hedging with cash if we’re wrong.  If we’re right about our first investment (the stock price rises) then we can use the cash to buy another stock near a new low.

Before bothering with the first of many gold stocks that we’ll be covering based on our Gold Stock Indicator, please review the following questions and answers:

  • Is there downside risk to taking positions in gold stocks at this time? Yes, price declines can reach as much as -50% within the first two months of the purchase.
  • Are you comfortable with declines of -50% or more?  If not, then don’t bother with these stocks at this time.  If you’re wondering about the logic of recommending anything that might decline by as much as –50% then please read our view on the topic (found here).
  • Could these stocks have been held for the “long-term?”  Ideally, yes, however, we believe that history is not on the side of gold stocks relative to the price of gold as we described in greater detail in our article titled “A Strategy is Needed For Lagging Gold Stocks”.

We believe that Edson Gould’s Altimeter, when revealing consistent relative values, yields highly favorable results.  While we always seek to purchases at a relative low, we always set a target for selling at higher levels rather than “holding for the long term.”  Our analysis could change if the stocks mentioned above dramatically increase or decrease their dividend.

Gold Stock Indicator: Nearing a Buy Signal for NUGT

Note: This article was posted on April 4, 2012 during market hours to active subscribers.   Because DUST is trading up today, April 5, 2012, it is still applicable.

On January 26, 2012, our gold stock indicator said that it was time to sell gold stock positions and go short gold stocks in general.  On February 8, 2012, we published an article on Seeking Alpha (article here) that said the trend was definitively down.  Since both the unpublished and published indications, the Direxion Gold Miners Bear ETF (DUST), our preferred vehicle for such a reliable indicator, has gained over +55%.

Being neither bullish nor bearish on gold and gold stocks, if you haven’t done so already WE RECOMMEND SELLING DUST at the market as we are nearing the point where an indication for the purchase of Direxion Gold Miners Bull ETF (NUGT) can be done with a reasonable expectation for substantial gain, as indicated in the chart below.

image

Despite the dramatic decline in gold and gold stocks on April 4, 2012, we must caution that the decline is not over.  The above charts indicate that the dual short and long term gold stock buy indication should occur between now and June 7, 2012.  However, we’re not there yet.

Our worst case scenario for a bottom in gold stocks is the period between June 15, 2012 and August 21, 2012.  While downside risk will be present after the buy indication, we believe that, on a relative basis, our signal will provide the most ideal opportunity to buy NUGT.

Our preference for using Direxion Gold Miners Bull (NUGT) and Direxion Gold Miners Bear (DUST) ETFs aren’t for the risk averse.  As noted in previous articles found on Seeking Alpha,  investors who wish to accumulate gold shares from within the XAU index should benefit from well-timed purchases rather than getting whip-sawed by a wildly gyrating index that will inevitably underperform the price of gold in the "long-term." We have identified the top five stocks that are likely to outperform the XAU index when the next buy signal is given. The five companies are AngloGold (AU), Yamana Gold (AUY), Gold Fields (GFI), Randgold (GOLD) and Royal Gold (RGLD).

Gold stocks are approaching an unprecedented short term buying opportunity.  If you’ve managed to follow our last gold stock indication, you have substantial profits to reallocate towards our preferred long instrument, Direxion Gold Miners Bull (NUGT), when our Gold Stock Indicator registers a buy signal.

Sell DUST at the market and be prepared to buy NUGT.

Gold Stock Indicator: Sell DUST

Our Gold Stock Indicator is supposed to indicated whether to buy the Direxion Daily Gold Miners Bear (DUST) [short gold stocks x 3] or the Direxion Daily Gold Miners Bull (NUGT) [go long gold stocks x 3].

On January 26, 2012, the Gold Stock Indicator gave an indication to “buy” the Direxion Daily Gold Miners Bear (DUST).  On February 7, 2012, we posted that the indication was for gold stocks to go down.  Below are charts indicating the price level for the Philadelphia Gold and Silver Stock Index (XAU) and short gold ETF (DUST) on both dates .

DUST XAU

Now that DUST appears to be in hyper-drive and the gains that have been registered, based on the closing price of DUST on February 7th and today, we recommend selling DUST.  At $41.68, DUST is up over +32% from the closing price of February 7th.  The gains achieved so far exceed the average gain of +26% in DUST represented in our chart of the Gold Stock Indicator since December 2010.

Based on the current standing of the Gold Stock Indicator, we believe that there is tremendous downside action for gold stocks.  However, we believe that if there is another washout in gold stocks, a buy indication for Direxion Daily Gold Miners Bull (NUGT) [go long gold stocks x 3] will quickly follow thereafter.  The moment the indication to consider buying NUGT arrives we will let you know.  For now, SELLING DUST at the market should be considered.

There are several caveats that we adhere to in regards to buying DUST or NUGT:

  • First, DUST and NUGT are speculative trading instruments that are not for the faint of heart. If you cannot accept declines of -15% then do not participate in these transactions. As with the January 26, 2012 buy indication for DUST, there is considerable downside volatility. It is best to assume that you’ll experience a significant decline in value immediately after you purchase either of these ETFs.
  • Second, set a target amount that you’d be willing to accept if the position goes your way and get out at that target amount. Although you may give up a considerable amount of the upside with a low target, we’d rather that you do no experience the gut wrenching loss that goes along with being in such volatile products.
  • Third, we expect that between now and  May/June 2012, there will be a major bottom in gold stocks and the current trend will be reversed.  This will throw off our ability to accurately call the intermediate moves in gold stocks. Once the current downtrend is complete we’ll have a long bias towards gold stock investing.

Gold Stock Indicator Points Down

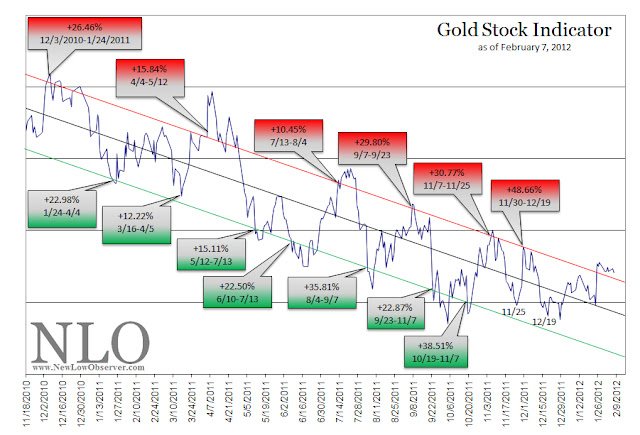
On November2, 2011, we posted an article titled “A Strategy is Needed for Lagging Gold Stocks.”  In that article we made reference to a Gold Stock Indicator that we’ve been using to determine the best times to buy and sell gold stocks.   Below is the same Gold Stock Indicator covering the period from November18, 2010 to February 7, 2012. 
In this example of the Gold Stock Indicator, we’ve provided the percentage change when the Direxion Daily Gold Miners Bear (DUST) [in red]and Direxion Daily Gold Miners Bull (NUGT) [in green] are bought and then sold when the Gold Stock Indicator has reached the opposite trend line.  In this example, the opposite of the NUGT trendline is the red trendline and vice versa. We’ve excluded the respective peaks and troughs in consideration of percentage change.  We only used the periods when the indicator first crossed the opposite trend line.
DUST and NUGT are ETFs that carry the highest risk of loss because they are intended to move at 3 times (3x) the NYSE Arca Gold Miners Index.  Therefore, DUST and NUGT are speculations and not investments.  Additionally,as the trend for the Gold Stock Indicator has been in a long declining phase,we expect that this pattern should reverse substantially at some point.  However, based on the current trajectory, we have May/June 2012 as our tentative reversal period.

A Strategy is Needed for Lagging Gold Stocks

For gold stock investors, a timing strategy is the most effective way to match or beat the coming metal price increase. Among our caveats, we’re excluding junior and exploration mining companies which will either go out of business, experience share price booms or get acquired by peers or the majors. What follows is our examination of whether the lagging gold stocks, the inability of gold stocks to perform equal to or greater than the price of physical metal, is unique to our time or a fundamental hallmark of gold bull markets.

There is considerable discussion about the divergence between the price of gold and gold stocks. In the divergence, the price of gold has tended to rise to new highs while gold stocks (majors) either trade in a range, decline or increase at a tepid rate compared to the physical metal.

Some argue that due to the divergence, gold stocks represent the best investment opportunity because inevitably, the stocks will catch up with the metal. Others say that, the lack of confirmation of gold stocks to exceed prior highs is an indication that the metal is overvalued or needs to decline.

Unfortunately, although both points seem well reasoned (along with many other explanations), evidence from the previous gold bull market suggests that gold mining majors typically underperform the metal. The primary source that we’re drawing from is Richard Russell’s Dow Theory Letters from 1970 to 1979 with data points confirmed in Barron’s and Kitco.com for the respective dates.

On numerous occasions, Richard Russell would express his concern for the divergence between the price of gold and gold stocks. Below are Russell’s observations of the failure of gold stocks to follow the price of gold higher:

Meanwhile, despite the recent highs in the price of gold bullion, the gold stocks are not keeping up with the price of the yellow metal. I have received many calls from subscribers asking why.” (Richard Russell, Dow Theory Letters, May 17, 1972, Letter 529, page 6.)

The general feeling seems to be that the gold stocks have been discounting [falling in advance of] a decline in bullion.” (Richard Russell, Dow Theory Letters, September 27, 1974, Letter 610, page 6.)

“‘What’s happening to the shares’ I am asked. ‘Why don’t they move with gold?’” (Richard Russell, Dow Theory Letters, January 2, 1975, Letter 618, page 5.

At the bottom of the chart is the Barron’s Gold Average (stocks). This may move, too, but this Average has a long way to go to hit its 1974 high while gold could better the old 200 high easily. That should tell us something. And it’s the reason I’ve been saying all along-gold, not gold stocks.” (Richard Russell, Dow Theory Letters, November 9, 1977, Letter 713, page 5.)

Since Barron’s Average is very heavily weighted in favor of ASA, we are looking to a large extent at the relative performance of the S. African gold shares against bullion. The picture is clear enough. The market, since mid-1974. has preferred bullion to the gold shares. And who am I to argue with the market? That’s the reason I’ve been recommending gold, not the shares.” (Richard Russell, Dow Theory Letters, February 17, 1978, Letter 722, page 6.)

Since late-January the gold stocks have been reactionary whereas gold has been hitting new 1977-78 highs. In March both stocks and the metal declined, and as you can see the stocks broke below their February lows. Yet the metal has not confirmed on the downside, holding well above its February low. I take this non-confirmation as a bullish indication. I think it is telling us that the metal will not respond to gold share weakness, and it is telling us that the metal ‘wants’ to go to new highs. Whether the stocks will follow is another story.” (Richard Russell, Dow Theory Letters, April 5, 1978, Letter 726, page 6.)

My chart of gold and the gold averages (see page 6) is now showing a dramatic divergence. The gold stock average has broke” below its November low, but the bullion price has held well above that point.” (Richard Russell, Dow Theory Letters, May 5, 1978, Letter 729, page 5.)

This non-confirmation between gold and the gold stock average which I discussed in the last Letter is still in force. Many feared that the reactionary tendencies [decline] in the gold shares were calling for a correction in gold. For this reason many advisors have been telling their clients to sell their gold or even short gold. The consequences have been unhappy for the sellers, disastrous for the shorts.” (Richard Russell, Dow Theory Letters, November 1, 1978, Letter 742, page 5.)

My chart of gold bullion (daily) and the Gold Stock Average (GSA) documents the extraordinary divergence which continues to build between gold and GSA. Why did gold and GSA rally in tandem up to the October highs and why are the gold shares so

reluctant now?” (Richard Russell, Dow Theory Letters, February 28, 1979, Letter 751, page 7.

My chart of daily gold and the gold stock average (GSA) continues to picture divergence, with Campbell Red Lake and ASA stubbornly refusing to move back to their October highs.” (Richard Russell, Dow Theory Letters, July 5, 1979, Letter 760, page 6.)

I obviously cannot tell at this time whether gold is going to surge above 307 to a new high- or whether gold is in the process of topping out. The gold stocks have been weak, and my gold stock average has broken below the three minor bottoms. But so far, even weakness in the gold shares has not rubbed off on the metal.” (Richard Russell, Dow Theory Letters, August 15, 1979, Letter 763, page 6.)

To add to the consternation of gold stock investors, the period after the peak in the price of gold in January 1980 showed gold stocks held up better than the metal. This threw off “seasoned” gold investors because it gave the false impression that gold’s collapse would recover somehow. The following is Russell’s comments on this matter after the peak:

The gold stocks did not act during the 1980 decline the way they did during the 1974 debacle. This time they tended to hold very well. Now they are looking bullish (despite the many troubles, the increasing troubles in So. Africa). The shares, in other words, show good relative strength against the metal. This is a good sign for gold in general.” (Richard Russell, Dow Theory Letters, June 4, 1980, Letter 784, page 5.)

Although gold stocks are a leveraged play on the price of gold, there are critical points in time when gold stocks should be bought and then sold in order to take advantage of the leveraged characteristics. Those who buy and hold gold stocks for the “long term” will be disappointed with the performance as compared to the price of gold. Therefore, it is necessary to have a timing indicator that will highlight the best times to invest in gold stocks.

Below we have constructed a gold stock indicator based on the Philadelphia Gold and Silver Stock Index (XAU) which reveals the best times to accumulate and dispose of gold stocks. The points above the red line indicates the time to sell gold stocks and the points below the green line indicate when to buy gold stocks. We’ve taken the liberty of considering a sell indication whenever the indicator first reaches the red zone on a move to the upside and a buy/accumulate when the indicator first falls to the green line on a move to the downside.
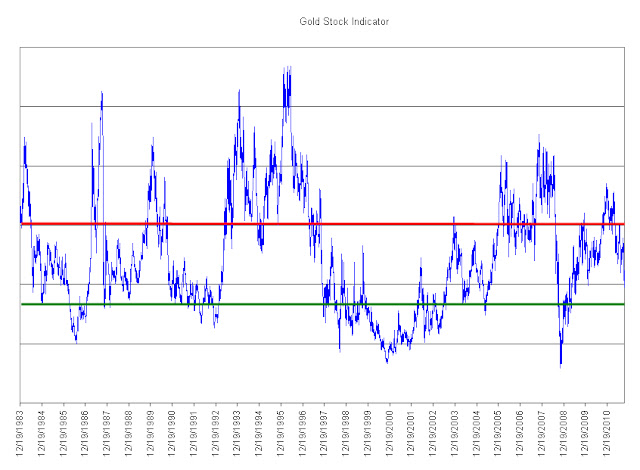
On average, sell indications occurred after a +52% increase in the XAU index. This does not account for the individual performance of gold stocks that are constituents of the index. The consistency of our Gold Stock Indicator reflected the best times to acquire the major gold stocks as well as the most ideal times to sell the gold stocks.
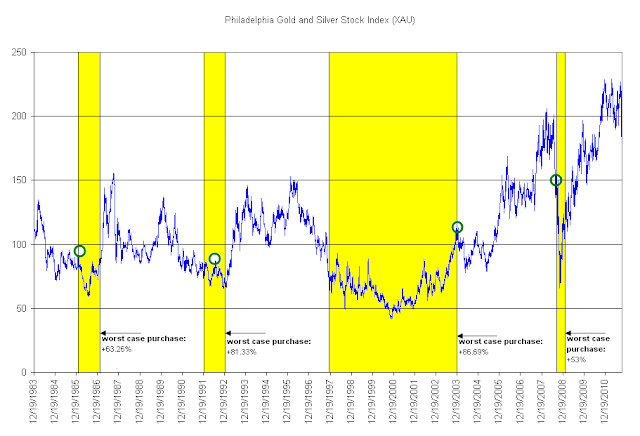
On the chart of the Philadelphia Gold and Silver Stock Index (XAU) above, we have shown where the indicated “buy/accumulate” recommendations would have taken place in yellow. The green circles show what would have happened if the purchase occurred at the worst possible time in the given period and is measured to the respective peaks in the XAU index soon after. As mentioned in many prior articles, we always account for at least -50% downside risk with any investment position that we take. This appears to be a minimum requirement when applying our indicator to the purchase of constituents of the Philadelphia Gold and Silver Stock Index (XAU).

For an investor who wishes to accumulate gold shares from within the XAU index, they would benefit from well timed purchases rather than getting whip-sawed by a wildly gyrating index that will inevitably underperform the price of gold in the “long-term.” We have identified the top five stocks that are likely to outperform the XAU index when the next buy signal is given. The five companies are AngloGold (AU), Yamana Gold (AUY), Gold Fields (GFI), Randgold (GOLD) and Royal Gold (RGLD).

The obvious alternative to buying gold stocks is with the physical asset. The paper version of gold is the SPDR Gold Shares (GLD). Although not truly tested through a full gold bull and bear cycle, GLD remains the among the most popular ways to “invest” in the physical asset. Our preference is for the non-paperized version of gold in the form of one-ounce coins.

As has been demonstrated in the gold bull market from 1970 to 1980, gold stocks (the majors) will generally underperform the price of gold. Those who are bound and determined to buy gold stocks can pursue the juniors and explorers which provide a wide range of outcomes that are independent of the price of gold (but helped by the rising value of gold) based on new discoveries, getting acquired or going bust. The alternative, buying the majors, should be done with a well constructed strategy that does not rely on hold-and-hope.