Category Archives: gold

Market Review and Analysis

As the Dow Jones Industrial Average (DIA) approaches the 12,000 level, we believe it is necessary to review our analysis leading up to this point. There have been indications that the market would knock on the door of 12,000. And we’ve been at the forefront of this analysis very early on.
Starting as early as February 12, 2009 (article here), we warned that despite the declining trend in the markets, history has proven that declines of 40% or more tend to retrace 60% to 100% of the previous decline.
In September 2009, after reviewing the Coppock Curve (article here), we pointed out that if the market held up in October 2009 that 12,000 on the Dow would not be an unrealistic price target.
In January 2010, we mistakenly thought that the Dow had a good chance to reach 12,000 by February 2010 (article here). Although we were woefully inaccurate in the timing of our estimate, we were convinced that 12,000 as an upside target was not unreasonable.
On March 23, 2010, we came out with an article that highlighted what we thought was confirmation of a cycle low in the market on February 8th (article here). In retrospect, although it was a major low for the year 2010, it was not as significant as the July 2010 low. However, we reiterated 12,000 as the target for the Dow.
Our eyes are now trained on the next target for the market. This is where our “analysis” is put to the test. All along we’ve thought that a rise from 6,400 to 12,000 would not be very unusual. However, getting back to even, or 14,164, will be very challenging. There are many who feel that external forces have falsified the markets rise.
As far as we’re concerned, we’ve accomplished the target that was long since projected and is now upon us. As we’ve indicated in a recent article, the Dow Industrials’ upward trend has less to do with the actions of the Federal Reserve and more to do with the corrective nature of markets after a significant plunge like in the period from October 2007 to March 2009 (article here).
We’ve noted in the article titled “Diversification Doesn’t Matter” that declines in the Dow will be amplified in the S&P 500 and Nasdaq Composite Index (article here). Exposure to these diversified indexes through the use of index funds and ETFs will result in surprising losses that defy the theory of diversification as was the case in 2008.
We believe that as long as the price of gold keeps moving higher in conjunction with the Philadelphia Gold and Silver Index (XAU) and Dow Theory confirmations of the bullish trend continue, there is a good chance that the market will retrace 100% of the previous decline from 2007 to 2009. At times like these, the rise and fall of the price of gold may be a leading indicator for where the market might be headed. Our numerous articles on the correlation between gold and the stock market have proven to be correct for those willing to accept the data from an unemotional standpoint (article link).
Although it is not unusual for markets to retrace 100% of a prior decline of 40% or more, we’re more than willing to figuratively step aside and watch what happens next. However, we cannot help taking another stab at when, and not at what exact level, the Dow Industrials will peak. Two prior articles on the topic are the basis for our thoughts on the prospects for where the top may occur.
On June 14, 2010, we wrote an article titled, “A Market Cycle Worth Observing” (article here). In that article, we reminded readers of the consistency of 4-year cycles to provide key markers for tops and bottoms in the market. We included referenced from Charles H. Dow’s era, founder of the Wall Street Journal, from 1901 and prior. We gave examples as provide by Richard Russell from 1953 to 1979. We were even able to provide examples from the period between 1987 and 2009.
If there really are 4-year cycles, as we contend, then October 2007 would stand as the marker for the last peak in the cycle. In theory, the mid-point for the peak would be some point in 2009. For us, March 9, 2009 represents the low or mid-point for the 4-year cycle. Our estimate is that the full 4-year cycle should be completed with the Dow Jones Industrial Average peaking at some point in 2011.
According to Dow Theory, the downside target is set at 9,273.50. If this level is breached in conjunction with the Dow Transports, then we could consider a bear market has been initiated.
The second article that we derived our view of the market is dated April 11, 2010 on the topic of Dow Theory (located here). In that market analysis, we proposed, in addition to the fact that the Dow Industrials “…could go to 11,574.59 with no problem,” we outlined three hypothetical scenarios under which the Dow Industrials would reach 14,164.
In retrospect, and upon further analysis, we realized that those projections were really indications for when the market would top irrespective of the exact level that the top would occur. It seems to us that the period from January 31, 2011 to June 18, 2011 is the timeframe for when the completion of the cycle should take place.
Despite our concerns for an eminent top in the market, we will continue to buy and sell individual stocks. From our experience in 2008, gains can be obtained from individual stocks within the context of a declining trend in the market. In fact, during 2008 there were only three months where losses were registered which were June, October and November. Although these months incurred substantial losses, 2008 ended with overall gains of 14% in our portfolio (article link).


Please revisit New Low Observer for edits and revisions to this post. Email us.

Watch List Double Take

After highlighting the performance of Sysco (SYY) during the commodity bull market from 1970 to 1983 on our recent NLO Dividend Watch List, we decided to see how another food distributor/producer stacked up against precious metal stocks.
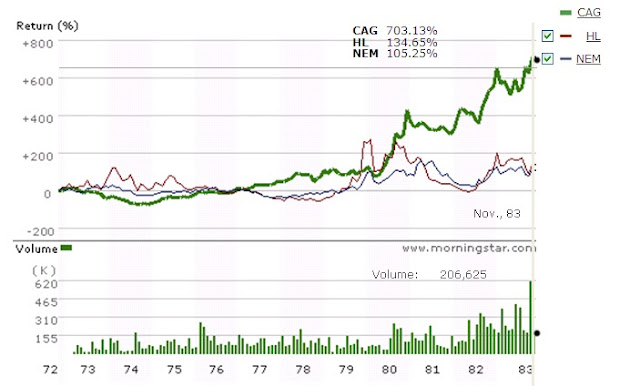
The total return chart of ConAgra (CAG) below (courtesy of Morningstar.com) should be all you need to know about alternative investment opportunities to gold and silver stocks.  Like Sysco (SYY), ConAgra (CAG) has had incredible performance against precious metal stocks during a period when there is a lot of hype about the benefits of investing in stocks like Newmont (NEM) and Hecla Mining (HL).  If you believe that record high inflation is coming down the road and you're a long-term investor and don't mind a 4.28% dividend yield, research in ConAgra (CAG) just might be for you.
Source: Morningstar.com, date range: 11/20/1972 to 11/19/1983


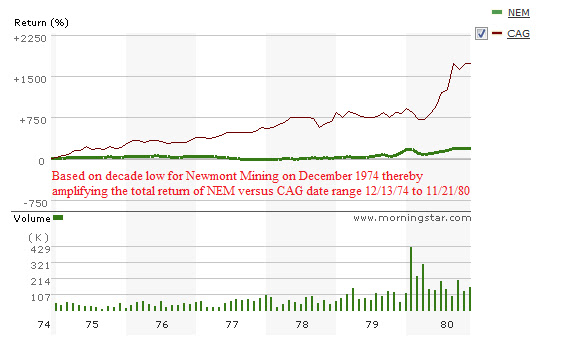
Below is a chart of CAG compared only to Newmont Mining (NEM) at the very lowest price of NEM on December 13, 1974 to the high of NEM at or near the peak of gold stocks.  In this case, NEM has the bold green line while CAG has the thin red line.  Note that CAG has a total return almost 17 times that of NEM.


Please revisit New Low Observer for edits and revisions to this post. Email us.

Homestake Mining: The Exception that Proves the Rule

In order to better understand the relationship of precious metals and precious metal stocks it is critical that investors get familiar with the periods of peaks and troughs of the gold and silver markets. Without this knowledge hardened gold and silver investors will succumb to forces that will result in major losses of capital.
In a prior article on gold we gave an example of how gold stocks in general suffered their biggest percentage loss from 1924 to 1932. However, in that same period, one gold stock, Homestake Mining [HM], managed to not only defy the declining trend but increased in value beyond all expectation. In the period from 1891 to 1987, Homestake Mining increased in value from $9 over $5000 per share. Because it is our assertion that gold and gold stocks rise and fall with the general market (either leading or slightly lagging), we will demonstrate that Homestake Mining is the exception that proves the rule.
Homestake Stock Splits:
  • 8 for 1 1937
  • 2 for 1 1968
  • 2 for 1 1974
  • 3 for 2 1980
  • 2 for 1 1983
  • 2 for 1 1987
This article will address several specific reasons why Homestake Mining [HM] was able to increase in value from $71 to $528 in the period from 1920 to 1940. It is important to note that of the reasons that we provide, no one factor could answer for the rise of Homestake Mining. However, the extent of the combined characteristics far outweighed the concerns gold investors had about the alternative gold stocks during the same period, especially from 1924 to 1933.
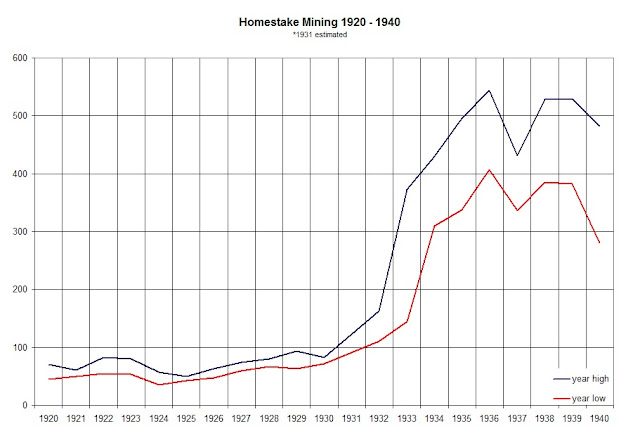
There are two kinds of factors that affected the price of Homestake Mining [HM]. One set are those that Homestake Mining cannot control while the second set are those that can be controlled. Those matters not in the control of the management of Homestake Mining [HM] helped to provide a support for the price of the stock. At the same time, those actions taken by the management of Homestake helped to significantly boost the price of Homestake Mining. The combination of the two elements allowed Homestake to emerge as the best performing gold stock in the worst possible markets.
We’ll first address the issues that were not in the control of Homestake Mining [HM]. The most important matter not in the control of Homestake management was the fixing of the gold price. With the price of gold being fixed, the share price and earnings of gold stocks were considered to be stable. This was especially true when the price of other commodities were falling. Few gold bugs will take on the seemingly tabooed topic of the price of gold being fixed as the reason gold and gold stocks were a refuge to investors. However, this alone, being fixed, is the basis by which all myths of gold being a safe haven are built upon.
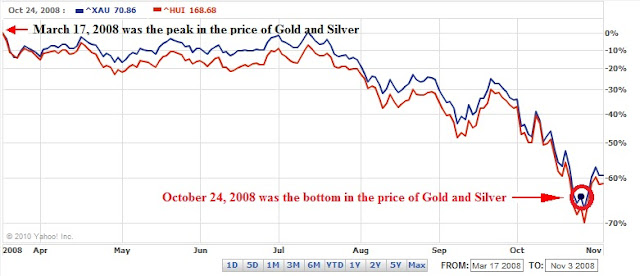
In more recent times, without a guaranteed price for gold, the commodity has fallen precipitously while gold stocks have been decimated. Some eternal gold bulls would say that during the market decline of 2007 to 2009 with the price of gold “only” falling 25%, in contrast to the Dow Industrials falling 40%, then it was an appropriate hedge. However, using the Philadelphia Gold and Silver Stock index (XAU), (a comparison of equity index to equity index) the decline was nearly 70% in a span of less than 1 year from March 2008 to November 2008. Gold was far from a source of stability during market panics of centuries past.
The next issue not in Homestake’s control was the limiting of the ability of the public to actually own (hoard) gold through the use of Executive Order 6102 issued by Franklin D. Roosevelt on April 5, 1933. This forced investors and savers in the U.S. to seek out the only alternative that existed which was gold equities. When markets seem to be falling apart, investors will seek out whatever happens to be the most stable option. Since owning gold wasn’t available the next best alternative was publicly traded gold stocks.
Also in 1933, President Franklin D. Roosevelt, through Executive Order 6260, authorized the U.S. Treasury to purchase gold at the highest traded world price allowing gold mining companies to increase their earnings by almost 50%. The purpose of this was to incentivize domestic producers to increase their output to shore up the U.S. government’s large outflow of gold that took place from 1929 to 1933.
Factors that were in the control of the management of Homestake Mining [HM] were many and especially effective in getting the stock price to increase in value. The cornerstone of Homestake’s success was their dividend policy. 53 years of continuous dividend payments helped Homestake grow to become the default choice for gold stock investments. The only year that Homestake didn’t pay a dividend was in 1920 which was a reflection of the state of the market for that year.
During times of crisis or when it was felt that the monetary situation was weakening, the management of Homestake Mining would increase the dividend or they would pay an extra dividend. This kind of proactive behavior boosted demand for the stock from institutions and the public even when the dividend exceeded the actual earnings. As an example, after Great Britain abandoned the gold standard, Homestake increased the dividend from $6 to $7.80 in 1931.
On other occasions, Homestake would routinely declare an extra dividend of $1. This dividend would typically come each September, which was in addition to the previously declared payments. While not guaranteed, the $1 extra dividend was paid almost every year and sometimes two or three times within a single year.
Inevitably the payments of dividends would only go so far. Without a profitable business, Homestake would be broke. To resolve this issue, Homestake Mining management was aggressive at increasing efficiencies. In the span of a five-year period, Homestake management was able to nearly double the gold recovery from $3.77 in 1925 to $6.17 in 1930.
The final piece that was essential to the incredible increase of Homestake Mining was the fact that the stock was thinly traded. This critical element, along with the others mentioned before, ensured that a gold mine in the Dakota territory, initially started by George Hearst (father of William Randolph Hearst), Lloyd Tevis and J.B. Haggin, would increase from $9 in 1891 to well over $5000 (unadjusted) by 1987.
The lessons of Homestake Mining may simply be a matter of circumstance, unfair labor practices, below market wages and the acquisition of land in the most unscrupulous fashion. However, some lessons about how Homestake management operated are likely to prove useful to the understanding the reasons why Homestake’s stock price continued to go up in value when others didn’t but should have.


Source Citations:

  • “Abreast of the Market.” Wall Street Journal. December 16, 1931. page 8.
  • “Abreast of the Market.” Wall Street Journal. May 6, 1932. page 8.
  • Rice, Claude T. “Premium Paid for Homestake.” Wall Street Journal. May 4, 1933. page 10.
  • “Gold Ruling Adds to Miners’ Income.” Wall Street Journal. August 30, 1933. page 1.
  • Poor’s High and Low Prices 1920-1930. Poor’s Publishing Company. 1931.
  • Poor’s High and Low Prices 1924-1933. Poor’s Publishing Company. 1934.
  • Poor’s High and Low Prices 1932-1940. Poor’s Publishing Company. 1941.

On the Brink of a Secular Bull Market in Precious Metals

In our “Commentary on Gold” dated November 11, 2008, we made some outlandish claims about the lack of performance by three undisputed experts on gold. One claim that we made was that “…when the price of stocks fall so too does the price of gold, and to a greater degree, gold & silver stocks.” This was said after the precious metals and the XAU and HUI indexes had already hit their final lows on October 24, 2008 and October 27, 2008 respectively. We demonstrated our claim through research performed by David Marantette which showed that from 1975 to 2001, declines of 10% or more in the Dow Jones Industrial Average resulted in larger declines in the gold stock indexes and the price of gold.  We completed the research by providing the data from 2001 to 2007.
The point of our December 9, 2008 article was best summed up in our closing paragraph:
“The long term trend in gold and silver stocks as demonstrated by the Philadelphia Gold Stock Index (XAU), which was initiated in November 2000, will eventually head permanently higher. The continuation of that trend will be among the key indicators that the bear market in stocks is at or near an end.”
Our overall assertion was, and is, if precious metals and their stocks continue heading higher so will the general stock market.  If the stock market starts to collapse then so too will the price of gold and silver and to a greater degree gold and silver stocks.
When we wrote our earlier pieces on precious metals, gold enthusiasts argued that the physical metal and the gold stock indexes are completely unrelated and therefore it doesn’t make sense to compare the two, not realizing that we weren’t comparing them at all. Other gold enthusiasts countered that with the price of gold falling only -29% from the March 2008 high investment in that area was justified considering that the Dow and S&P 500 had fallen over -35% in 2008, not realizing that losing less money isn’t the reason why people invest. Not liking the outcome of the data, because it only covered the period from 1975 to 2007, some said that it didn’t go back far enough.To respond to the critics about our data, we gathered prices of gold and silver stocks from 1924 to 1933. That data demonstrated that gold and silver stocks got hammered during that period. Below we have included a previously unpublished Gold Stock Average of the 13 precious metal stocks (out of 21) with complete price history from 1924 to 1933.

Gold Stock index 1924-1933

As you can plainly see, when you exclude the performance of Homestake Mining, the value of the gold stocks fell 76.47% from their peak in 1925 to the bottom in 1932.  This performance is in line with the decline of the Amex Gold Bug Index (HUI) from March 14, 2008 to October 27, 2008; which has 16 precious metal stocks in it.  In the chart below, you can see that the HUI index and the Philadelphia Gold and Silver Index (XAU) fell 70.56% and 68.15% respectively,  within the 8-month period.

Few people will readily agree that all the deflating of the financial system has been expunged from the markets. However, when compared to the deflation that took place from 1924 to 1932, first reflected in the gold stocks and later the entire stock market,  it becomes very clear that the general stock market decline of over 50% and the eight month decline of the gold stock index on such a large scale signaled the end of the deflationary period. For investors, one area we think that holds the most promise is in silver.

On September 9, 2009 we wrote an article titled “Silver Should be the Focus.”  We indicated that if there were a need to participate in the run in precious metals, silver would be the best investment/speculative choice.  At the time, silver closed at $16.36 an ounce.  On Friday September 24, 2010, silver closed at $21.46 with an increase of 31.17%.  During the same period of time, the price of gold increased 30.61%.  So far, the precious metals appear to be in lock step with each other since our last article on the topic.  However, since the bottom in the market on October 24, 2008, the price of gold is up 82% with the price of silver is up 142%.  Although these are considerably large increases in value in a very short period of time, compared to past price increases the current moves are in their infancy.

The most pressing matter for the precious metals market right now is confirmation.  So far, the price of gold and silver has exceeded their respective 2008 highs.  However, the corresponding stock indexes, the XAU and the HUI, have not yet confirmed the trend.  If the trend is confirmed then we will have received the indication of the beginning of a secular bull market in gold and silver.  In our Richard Russell Review posted on July 4, 2010, we outlined Russell’s significant detail on the importance of confirmations.  Although our analysis shows how Russell got the interpretation incorrect, it is well worth re-examining this article since it outlines exactly how to utilize both indicators (price of gold and gold stock index) for confirmation of the trend.
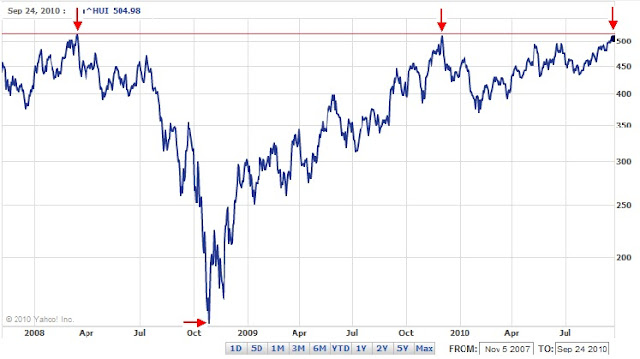
Below is the HUI index with what appears to be the third attempt at the 514.89 level.
 
Although not likely, failure to breach the 2008 peaks for the XAU and the HUI index could mean very hard economic times ahead.  Alternatively, going above the previous peak, which seems much more likelier, may mean that we’re entering the early stages of higher interest rates and inflation.  It is necessary to keep in mind that higher inflation and higher interest rates won’t initially wreck havoc on the economy.
Most investors have the tendency to remember only the periods at the extremes, the real estate bust, the real estate bubble, the dot com bust, the dot com bubble, the gold bubble and the gold bust, skyrocketing interest rate, the current zero interest rate environment.  In every instance, the recollection of such periods is rooted in the final stage. However, what is more important is the slow transition that takes place from trough to the next peak. 
In the case of inflation, the slow transition was the innocuous period, saved for a world war, from 1932 to 1966.  Unfortunately, most investor over concentrate on the period from 1973 to 1980 due to the exaggerated moves upward.  The transitional period brought many cyclical and one secular bull market in the Dow Jones Industrial Average. It is possible that as our inflation rate climbs the Dow Jones Industrial Average could experience a bull market similar to the period form 1949 to 1966.
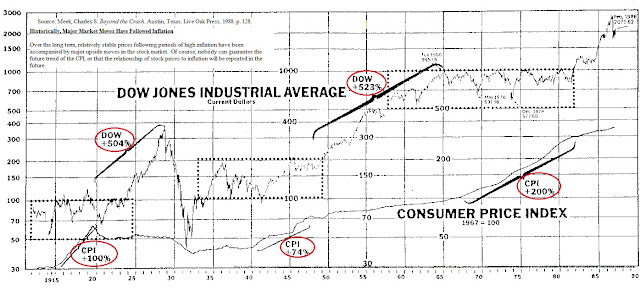
According to the chart below, periods of inflation coincided or preceded extremely large moves in the stock market.  The period from 1940 to 1947 had a 74% increase in the CPI while at the same time the stock market doubled in value.  Naturally the argument is that the stock market only managed to beat inflation by a small amount over that period.  The reality is that the response by the Dow Industrials was to go from the 100 level in 1941 to the 1000 level in 1966.

Looking at the chart above, it is hard to believe that the CPI increase of 200% in the 1970's would follow the pattern of previous high inflation periods with stocks increasing 10 times in each instance.
While we watch and wait for the confirmation of the new high in the price of gold and silver with the XAU and HUI indexes by breaking above their 2008 highs, our overall assertion still is that if precious metals and their stocks continue heading higher so will the general stock market.

Richard Russell Review: Letter 745

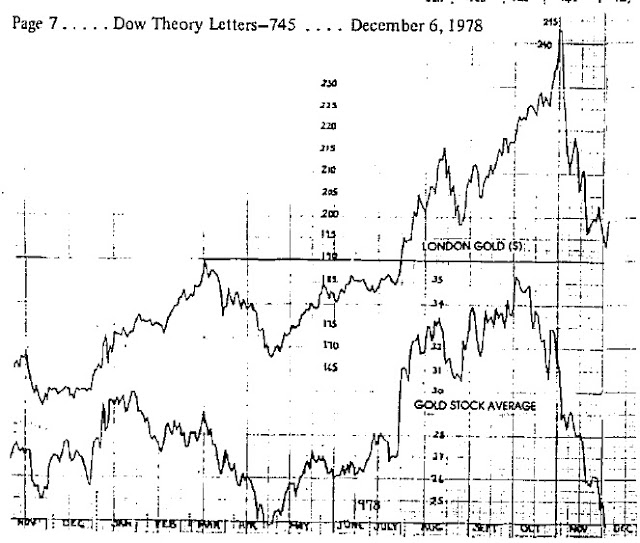
Dow Theory Letters Issue 745 was written on December 6, 1978.  At the time, the Dow Jones Industrial Average was indicated to be at the 811.42 level.  What stood out the most to me was the fact that Richard Russell made very clear commentary on the price of gold and the direction of stocks.  Russell made the following commentary:

"It [gold/stock ratio] is telling us that for the foreseeable future (until the next signal), if we do anything we should do it in stocks." page 3.

Anyone familiar with the stock market in 1978 would know that if you had bought a handful of stocks and didn't sell them until 10 years later you would have had a compounded annual growth rate of 8.73% (this takes into consideration the crash of 1987).  Russell's comments on being in stocks would have seemed to be very much on target.  However, it is his aversion to gold at this time that seems to contradict his earlier comments on gold.
In Letter 742 dated November 1, 1978, Richard Russell said the following about gold:
"Slowly, very slowly, it's dawning on the world that we're witnessing one hell of a bull market-in gold. I've been writing pages and pages about gold in each Letter, trying to get new subscribers in the metal (or the coins), trying to get older subscribers to STAY in gold.  Happily, a large percentage of my subscribers are now sitting with large gold positions.  And the paper profits (in terms of dollars) are mounting." page 5.

This commentary seems odd because in Letter 745, Russell goes on to say:

"At any rate, it is a bearish omen when the [gold] open interest stays high in the face of a persistent decline, and that is what has occurred." page 6

Russell called himself to task by asking the following question:

"Question: Russell, you were so hot on gold a few months ago.  Gold was 'real money,' you said.  Gold 'would save the system,' you said.  How can you just "turn off" on gold?
"Answer: I haven't turned off on gold, I've turned off on gold at this time.  The market isn't like your wife or your daughter who you love through thick and thin.  We're dealing here with correct procedure and purchasing power.  The fact that I advocate gold-backed currency has nothing to do with the fact that I think gold is in a bear trend over the coming months.  In this business, you had better learn that the trend makes you the money, not the item.  I'd rather buy Cesspools, Inc. if that stock was going up than IBM if IBM is heading down." Page 7
In retrospect, we know that gold went as high as $850 an ounce in January 1980.  However, it is interesting to me that Russell said that a bear trend was approaching "...over the coming months."  In Letter 745, Russell included a chart that compared the London Gold to the Gold Stock Average.


Russell's favorable comments of gold on November 1, 1978 were well off of the highs from the prior month.  However, since Russell was a practioner of Dow Theory and was using the London price of gold along with the equivalent of the XAU gold index to act as a confirming mechanism for the future price of gold, it should have been considered that because the London price didn't fall to the corresponding low set in April of 1978 that there must have been a non-confirmation of the downside trend.  Instead, Russell said the following:
"The GSA [Gold Stock Average] has collapsed, and is now down to its previous low for the year recorded last April.  Bullion has obviously held up better than the gold shares, but so far the downside non-confirmations by bullion have failed to halt the decline.  This kind of action is always indicative of a weak market, and it just seems that there are still too many optimistic gold-holders around." Page 6.
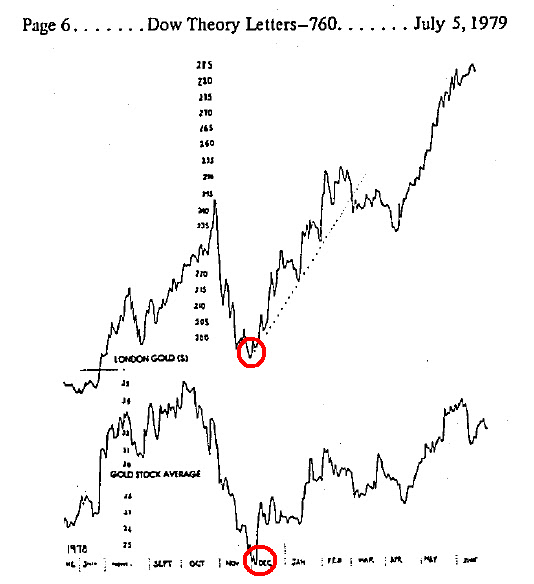
Is it possible that the gold shares are held by the public and speculators (weak hands) and the bullion is held by investors and "institutions" (strong hands)?    Somehow I think this relationship has some value.  I'm just not sure if Russell called this intermediate move correctly.  So I decided to search for an updated version of the London Gold and GSA comparison.  Below is what I found in the July 5, 1979 issue:


It should be noted that the exact bottom in the price of gold and gold stocks (red circles) coincided with the publishing of the December 6, 1978 Letter 745.
Also Worth Mentioning:
  • Russell said that "Greed and options don't mix."  My impression on this remark is that I always thought that the purpose of options is to get exaggerated gains with the trade-off being no equity.  Seems to me that greed and options go hand in hand.
  • Dow Theory Letters are available at http://www.dowtheoryletters.com/
More:

AngloGold (AU) and Other SA Stocks Offer No Margin of Safety

If we're on the brink of a breakout to gold at $9,000 an ounce as UBS claims (source: Financial Times, requires registration) then let the party begin. By my own calculations, after halving my worst case scenario, gold could go as high as $9,414.16. Yeah, I know, make an outrageous claim and cement your fame. However, I have a logical explanation for my belief that a run up in gold is possible.

Confidence in my math on how gold could plausibly get to $9,000 is actually less important than the wait that we're in for to get to such a level. After all, the rise from $35 an ounce in 1969 to $800 an ounce in 1980 took a lot of twists and turns. I personally believe that we'd see a collapse in the price of gold and other related commodities before we move to the insane levels that I mentioned earlier.

If you compare the yields on gold stocks today to the 1970's you'd think we were on different planets. As an example, Barrick Gold (ABX), a "domestic" producer, has a dividend yield of 1% while AngloGold Ashanti (AU) has a paltry yield of 0.40%. DRDGOLD (DROOY), the old Durban Deep, has the massive yield of 1.4%. In the list of gold stock provided by Richard Russell, only 3 stocks sported no dividend. None of the publicly traded South African gold producers have dividend yields that provide a margin of safety.

In an earlier posting, I scoffed at the notion of gold stocks paying a dividend just to get investors into the market. Despite that concern, it doesn't stop me from believing that if we are really in a long term bull market in commodities (inflationary period) then it would certainly be nice to get compensate for the wait.

Keep your mind open to the prospect that even if some gold stocks are paying a dividend just to get speculators in, there might be a chance that the current run up in gold is a repeat of the early stages of a genuine gold bull market. If you happen to find gold stocks with such outrageous yields then let me know, I'm always interested (only those with earnings please.) Touc.

*See my note on commodities in the comment section of my September 12, 2009 posting.


Please revisit Dividend Inc. for editing and revisions to this post.

Silver Should be the Focus

I watch with glee as Yahoo!Finance includes a price quote for gold in the Market Summary section on their home page. After all the financial turmoil that we've been through since the introduction of the internet, when did Yahoo!Finance realize that a gold quote was necessary? The obvious answer is, "When the public demands it."

Well, when the public finally demands the price quote of gold on their finance homepage, it is probably too late to participate in gold on a level that could be considered meaningful. After all, at nearly $1000 an ounce, there isn't going to be a stock split in the price of gold. Or is there? (I've been pondering this possibility lately) In any event, gold is fast becoming an expensive asset in a world full of correspondingly deflating alternative "assets." What to do? What to do? Get out there and do your research on silver!!! That's what you do!!!

I say do your research on silver because if I told you that, regardless of the Hunt Brothers cornering the silver market in the 70's, the price of silver always outpaces gold on a percentage basis by a ridiculous margin, you'd probably laugh in my face. But as you should know, silver is the "poor man's gold" and coincidentally, there are more "poor" men than rich men can afford to buy.

When I first bought gold and silver back in 1996 (in bulk and never purchased again), I knew that I was getting a bargain. When I exchanged 75% of my gold for silver in 2008, I knew I was committing highway robbery. I've always noted that "gold bugs" were blinded by the historical significance of the yellow metal, while at the same time claiming that they were investors who used gold as a form of insurance against government mismanagement of paper currency.

The real deal is in the price of silver. While gold has run up 259% since I purchased it, silver has gone up only 266% in the same period. This means that silver hasn't appreciated as much as it historically should relative to the price of gold. Which begs the question, what should we expect silver to do relative to gold? I have my own calculations for the future price of gold and silver. But more importantly, let's look at what history has to offer us.

I like chopping everything into halves. This means that if the Hunt Brothers' cornering of the silver market brought the price of silver to $50 then the real price probably should have been $25. From this vantage we now have to choose a starting point. Where did the price of silver start out?

For illustrative purposes, let's start with the bottom of 1932 and compare silver with gold. At the low in 1932, silver was priced as low as $0.24 an ounce. Gold, on the other hand, was fixed at $20.67 per ounce. At the peak of the market in 1980, gold was selling at $800 an ounce while silver was selling at $50 an ounce. During the period from 1932 to 1980, gold went up 3,770% while silver went up 20,730%.

Gold bugs, ever clinging to their religion, would argue that silver was cornered so the $50 figure was a fraud. Gold bugs would also claim that if gold was allowed to freely float during the crisis of 1929-1932 then gold would have been much higher than the price of silver in 1932. These arguments demonstrate a lack of knowledge on how commodity markets work, basic economics and history in one fell swoop.

For the aforementioned reasons, I will calculate the change of silver from $0.24 to $25. Despite halving the figure, silver still achieves an astounding 10,316% increase from the low of 1932. Any way you slice it, the ratios are completely disfigured and in favor of silver. I could have started my pricing point in the 1950's, 1960's or the 1970's and the distortion would be the same but that would be an exercise in futility when talking to a gold bug. Their retort is always the same, "what about this?" or "You're being selective" or "You're biased" or etc. etc. etc. ad infinitum...

Back to me and my silver holdings, when the price of silver has moved in step with the price of gold, on a percentage basis, then I know that silver is underpriced as a precious metal. With this in mind, I converted a majority of my gold holdings into silver. I'm an investor, therefore I don't want to get myself caught up in the religions debates about gold.

So, if (note the size of the if) you're considering taking the dive into gold then move on to the alternative with every bit the attribute. I suggest that you avoid the numismatic varieties of silver. Instead, aim for junk silver of the half dollar denominations. Again, only buy precious metals as part of a balanced diet of physical real estate, stocks, bonds and cash.

In my opinion, gold and silver stocks are perpetual options on the price of gold and silver. Therefore, precious metal stocks are great for speculation but poor investment choices. Be mindful of the coming competitive dividend war between precious metal companies. I remember one, now defunct, gold company that paid out their dividend in actual gold. These are all gimmicks to lure investors in at a time when the rule of the day should be "head to the exits."

If you've read my blog at any length then you already know of the Dividend Achievers that have beat gold and silver stocks without the added risk. However, if you're a hardened equity speculator, you could nab select gold and silver convertible preferreds. Gold and silver equities aren't my first choice but now you know some of the options available to you.

A Note of Caution for All Precious Metal Investors
As the price of the precious metals get higher, the less likely you'll get the widely quoted price when trying to cash in. Precious metal dealers, being business folk, will not be willing or able to take the risk of buying back your gold and silver at the highest quoted price. Therefore, even though gold was at $800 and silver was at $50 back in 1980, investors who tried to cash in at those prices were being turned away by dealers. This will be one of the signs that we're at a top in the market for precious metals.

When you read the following articles on gold and silver, you need to understand that I have a vested interest in the topic. Therefore, I theoretically should say things that only support the investment positions that I retain. Unfortunately, I don't see (revealing my limitations) the value of the philosophy of "whose food I eat, whose song I sing." Additionally, it would be no contradiction that I would explore and write about the breadth of both sides of the topic of precious metals investing. Touc.

related articles:


Please revisit Dividend Inc. for editing and revisions to this post.