Category Archives: grmn

Nasdaq 100 Watch List: February 26, 2016

Performance Review

Below is the percentage change in the stocks that appeared on our February 22, 2015 watch list:

symbol name 2015 2016 % chg
GRMN Garmin Ltd. 49.42 40.4 -18.25%
MAT Mattel, Inc. 25.77 32.47 26.00%
NUAN Nuance Communications, Inc. 14.02 19.59 39.73%
FAST Fastenal Company 42.76 45.22 5.75%
FOSL Fossil Group, Inc. 85.14 47.04 -44.75%
DISCA Discovery Communications, Inc. 30.93 25.08 -18.91%
KLAC KLA-Tencor Corporation 64.97 67.97 4.62%

The average performance of the entire watch list was –0.83% while the Nasdaq 100 index declined –4.81%.  A stock that we had some interest in was Garmin (GRMN).  In our commentary we said the following:

“There is no hard and fast rule for what has occurred in a generally rising market.  However, it is well worth the time to examine the investment merit of GRMN when the stock has fallen –29% or more.”

In the case of Garmin, falling –29% from the prior peak would have meant that the stock would at $43.80 or lower.  GRMN did not achieve this until early July 2015.  Since that time, GRMN has fallen an additional –31%.  At the current time, GRMN has not achieved the breakeven level of $43.80.

Watch List and Analyst Estimates

Below is the latest Nasdaq 100 Watch List for February 2016.

Nasdaq 100 Watch List: May 24, 2013

Below are the Nasdaq 100 companies that are within 11% of their respective 52-week lows. Stocks that appear on our watch lists are not recommendations to buy. Instead, they are the starting point for doing your research and determining the best company to buy. Ideally, a stock that is purchased from this list is done after a considerable decline in the price and rigorous due diligence.

Continue reading

Nasdaq 100 Watch List: March 19, 2013

Below are the Nasdaq 100 companies that are within 10% of their respective 52-week lows. Stocks that appear on our watch lists are not recommendations to buy. Instead, they are the starting point for doing your research and determining the best company to buy. Ideally, a stock that is purchased from this list is done after a considerable decline in the price and rigorous due diligence.

Continue reading

Nasdaq 100 Watch List: February 8, 2013

Below are the Nasdaq 100 companies that are within 10% of their respective 52-week lows. Stocks that appear on our watch lists are not recommendations to buy. Instead, they are the starting point for doing your research and determining the best company to buy. Ideally, a stock that is purchased from this list is done after a considerable decline in the price and rigorous due diligence.

Continue reading

Nasdaq 100 Watch List

Watch List Summary

At the end of the week for September 17, 2010, the top performing stocks from our Nasdaq 100 list for August 15, 2010 are Oracle (ORCL) with a gain of 21.27%, Qualcomm (QCOM) with a gain of 12.07% and Computer Associates (CA) with a gain of 11.57%.
The worst performing stocks from our August 15th watch list are Intel (INTC) down –1.78%, Applied Materials (AMAT) down –1.34% and Activision (ATVI) down –0.46%.
The average gain for the watch list was 6.33%. Of the two stocks that we pointed out as being standouts from August 15th, Garmin (GRMN) exceeded the average return by climbing 9.57% while Paychex (PAYX) underperformed the average gain by rising 3.92%.
A distinction that needs to be made between this week’s list and our August 15th list is that we’ve ranking the companies on this list by those stocks nearest their 52-week low. Our previous list was ranked by those stocks that had the highest dividend yield and within 20% of their respective 52-week low.

Performance Review

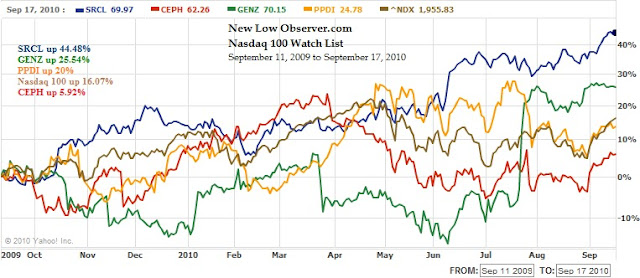
The following is a total return (appreciation plus dividends) performance review of our Nasdaq 100 Watch List from September 11, 2009:
  • Stericycle (SRCL) up 44.48%
  • Genzyme (GENZ) up 25.54%
  • Pharmaceutical Product Development (PPDI) up 20%
  • Cephalon (CEPH) up 5.92%
As a group, the average gain for the stocks mentioned was 23.99%. This is contrasted by the Nasdaq 100 gain of 16.07% in the same period of time.

*chart does not reflect dividend reinvestment for PPDI


Nasdaq 100 Watch List

Below are the Nasdaq 100 companies that are within 20% of their respective 52-week lows. Stocks that appear on our watch lists are not recommendations to buy. Instead, they are the starting point for doing your research and determining the best company to buy. Ideally, a stock that is purchased from this list is done after a considerable decline in the price and rigorous due diligence.

Symbol Name Price P/E EPS Yield P/B % from Low
PAYX Paychex, Inc. 25.95 19.67 1.32 4.80% 6.67 5.27%
INTC Intel Corporation 18.81 11.26 1.67 3.40% 2.3 6.87%
AMAT Applied Materials, Inc. 11.02 24.44 0.45 2.50% 2.03 7.33%
YHOO Yahoo! Inc. 13.89 22.77 0.61 N/A 1.59 7.34%
MXIM Maxim Integrated Products, Inc. 16.91 41.86 0.4 5.00% 2.15 7.91%
GILD Gilead Sciences, Inc. 34.56 10.47 3.3 N/A 4.58 8.93%
ATVI Activision Blizzard, Inc 10.82 41.94 0.26 1.30% 1.21 8.96%
DELL Dell Inc. 12.45 15.74 0.79 N/A 3.92 9.80%
RIMM Research In Motion Limited 46.72 10.24 4.56 N/A 3.2 9.85%
AMGN Amgen Inc. 55.22 11.73 4.71 N/A 2.28 9.87%
DISH DISH Network Corporation 18.77 11.26 1.67 N/A N/A 10.02%
CSCO Cisco Systems, Inc. 21.86 16.46 1.33 N/A 2.82 10.31%
XRAY DENTSPLY International Inc. 30.66 16.55 1.85 0.70% 2.6 10.45%
MSFT Microsoft Corporation 25.22 12 2.1 2.10% 4.76 10.95%
SPLS Staples, Inc. 19.49 17.26 1.13 1.80% 2.2 11.69%
PDCO Patterson Companies Inc. 27.15 14.67 1.85 1.50% 2.3 12.52%
SHLD Sears Holdings Corporation 66.83 27.38 2.44 N/A 0.9 12.87%
GOOG Google Inc. 490.15 21.29 23.03 N/A 3.77 13.03%
LIFE Life Technologies Corporation 46.51 29.91 1.56 N/A 1.97 13.16%
STX Seagate Technology. 11.16 3.55 3.14 N/A 1.95 13.41%
FLIR FLIR Systems, Inc. 27.24 18.52 1.47 N/A 3.25 13.50%
GRMN Garmin Ltd. 29.64 8.95 3.31 5.10% 2.21 13.52%
TEVA Teva Pharmaceutical Industries 53.48 19 2.82 1.20% 2.48 13.81%
FLEX Flextronics International Ltd. 5.55 15.72 0.35 N/A 2.26 14.20%
COST Costco Wholesale Corporation 61.29 21.93 2.8 1.30% 2.43 14.75%
HSIC Henry Schein, Inc. 56.35 15.82 3.56 N/A 2.31 14.77%
CERN Cerner Corporation 79.18 31.31 2.53 N/A 3.83 14.85%
CELG Celgene Corporation 55.25 29.99 1.84 N/A 5.11 15.06%
CA CA Inc. 20.44 13.43 1.52 0.80% 2.02 15.48%
ERTS Electronic Arts Inc. 16.26 N/A -1.06 N/A 1.96 15.63%
VRTX Vertex Pharmaceuticals Incorpor 36.25 N/A -3.53 N/A 9.01 16.00%
KLAC KLA-Tencor Corporation 31.05 25.31 1.23 3.30% 2.32 16.34%
STLD Steel Dynamics, Inc. 15.01 15.73 0.95 2.00% 1.58 16.45%
WCRX Warner Chilcott plc 22.75 11.2 2.03 N/A 2.82 16.55%
LOGI Logitech International S.A. 15.39 22.57 0.68 N/A 2.68 16.86%
CEPH Cephalon, Inc. 62.26 12.48 4.99 N/A 2.09 17.36%
URBN Urban Outfitters, Inc. 34.11 22.19 1.54 N/A 4.26 18.85%
FWLT Foster Wheeler AG. 24.19 10.8 2.24 N/A 3.46 18.99%
FISV Fiserv, Inc. 53.56 17.16 3.12 N/A 2.57 19.55%
JBHT J.B. Hunt Transport Services, I 35.26 26.73 1.32 1.40% 7.56 19.73%
CTAS Cintas Corporation 27.71 19.64 1.41 1.70% 1.67 19.96%