Members
-
Topics
Archives
-
-
Recent Posts
-
-
-
Investor Education
Market Return After Exceptional Years
Dollar Cost Averaging Tool
Dow Theory: The Formation of a Line
Dividend Capture Strategy Analysis
Golden Cross – How Golden Is It?
Debunked – Death Cross
Work Smart, Not Hard
Charles H. Dow, Father of Value Investing
It's All About the Dividends
Dow Theory: Buying in Scales
How to Avoid Losses
When Dividends are Canceled
Cyclical and Secular Markets
Inflation Proof Myth
What is Fair Value?
Issues with P-E Ratios
Beware of Gold Dividends
Gold Standard Myth
Lagging Gold Stocks?
No Sophisticated Investors
Dollar down, Gold up?
Problems with Market Share
Aim for Annualized Returns
Anatomy of Bear Market Trade
Don’t Use Stop Orders
How to Value Earnings
Low Yields, Big Gains
Set Limits, Gain More
Ex-Dividend Dates -
-
Historical Data
1290-1950: Price Index
1670-2012: Inflation Rate
1790-1947: Wholesale Price Cycle
1795-1973: Real Estate Cycle
1800-1965: U.S. Yields
1834-1928: U.S. Stock Index
1835-2019: Booms and Busts
1846-1895: Gold/Silver Value
1853-2019: Recession/Depression Index
1860-1907: Most Active Stock Average
1870-2033: Real Estate Cycles
1871-2020: Market Dividend Yield
1875-1940: St. Louis Rents
1876-1934: Credit-New Dwellings
1896-1925: Inflation-Stocks
1897-2019: Sentiment Index
1900-1903: Dow Theory
1900-1923: Cigars and Cigarettes
1900-2019: Silver/Dow Ratio
1901-2019: YoY DJIA
1903-1907: Dow Theory
1906-1932: Barron's Averages
1907-1910: Dow Theory
1910-1913: Dow Theory
1910-1936: U.S. Real Estate
1910-2016: Union Pacific Corp.
1914-2012: Fed/GDP Ratio
1919-1934: Barron's Industrial Production
1920-1940: Homestake Mining
1921-1939: US Realty
1922-1930: Discount Rate
1924-2001: Gold/Silver Stocks
1927-1937: Borden Co.
1927-1937: National Dairy Products
1927-1937: Union Carbide
1928-1943: Discount Rate
1929-1937: Monsanto Co.
1937-1969: Intelligent Investor
1939-1965: Utility Stocks v. Interest Rates
1941-1967: Texas Pacific Land
1947-1970: Inventory-Sales Ratio
1948-2019: Profits v. DJIA
1949-1970: Dow 600? SRL
1958-1976: Gold Expert
1963-1977: Farmland Values
1971-2018: Nasdaq v. Gold
1971-1974: REIT Crash
1972-1979: REIT Index Crash
1986-2018: Hang Seng Index Cycles
1986-2019: Crude Oil Cycles
1999-2017: Cell Phone Market Share
2008: Transaction History
2010-2021: Bitcoin Cycles -
Interesting Read
Inside a Moneymaking Machine Like No Other
The Fuzzy, Insane Math That's Creating So Many Billion-Dollar Tech Companies
Berkshire Hathaway Shareholder Letters
Forex Investors May Face $1 Billion Loss as Trade Site Vanishes
Why the oil price is falling
How a $600 Million Hedge Fund Disappeared
Hedge Fund Manager Who Remembers 1998 Rout Says Prepare for Pain
Swiss National Bank Starts Negative
Tice: Crash is Coming...Although
More on Edson Gould (PDF)
Schiller's CAPE ratio is wrong
Double-Digit Inflation in the 1970s (PDF)
401k Crisis
Quick Link Archive
Category Archives: HUI
Upside Targets for Individual Gold Stocks
We’ve come to the time when we need to determine the upside targets for gold stocks. There are a few assumption that we’re making in this assessment. First, we believe that our Gold Stock Indicator is right about the direction of gold stocks, in general. Second, we’re assuming that from the current levels there is more downside risk. Third, we have excluded fundamental analysis (government printing, future earnings capacity, gold as money, etc.) from our assessment of the upside potential for individual gold stocks.
Posted in Edson Gould, gold, gold bugs, Gold Stock Indicator, HUI, Performance Review, speed resistance line, SRL, upside target, XAU
Tagged members
On the Brink of a Secular Bull Market in Precious Metals
“The long term trend in gold and silver stocks as demonstrated by the Philadelphia Gold Stock Index (XAU), which was initiated in November 2000, will eventually head permanently higher. The continuation of that trend will be among the key indicators that the bear market in stocks is at or near an end.”
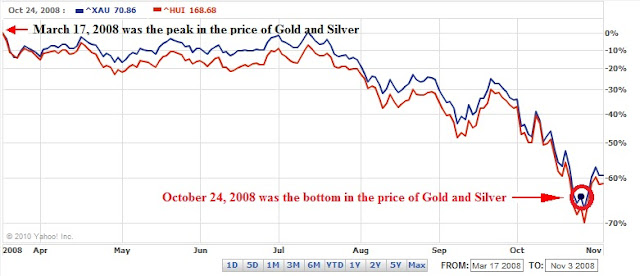
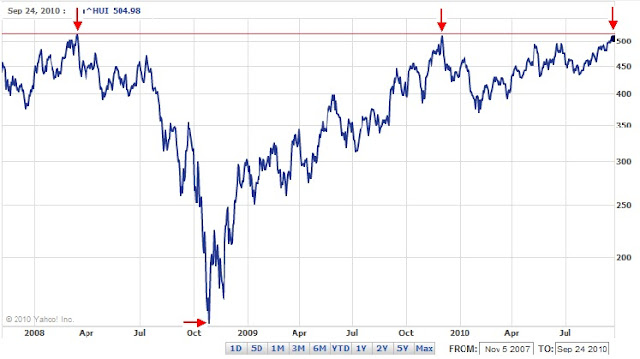
As you can plainly see, when you exclude the performance of Homestake Mining, the value of the gold stocks fell 76.47% from their peak in 1925 to the bottom in 1932. This performance is in line with the decline of the Amex Gold Bug Index (HUI) from March 14, 2008 to October 27, 2008; which has 16 precious metal stocks in it. In the chart below, you can see that the HUI index and the Philadelphia Gold and Silver Index (XAU) fell 70.56% and 68.15% respectively, within the 8-month period.
On September 9, 2009 we wrote an article titled “Silver Should be the Focus.” We indicated that if there were a need to participate in the run in precious metals, silver would be the best investment/speculative choice. At the time, silver closed at $16.36 an ounce. On Friday September 24, 2010, silver closed at $21.46 with an increase of 31.17%. During the same period of time, the price of gold increased 30.61%. So far, the precious metals appear to be in lock step with each other since our last article on the topic. However, since the bottom in the market on October 24, 2008, the price of gold is up 82% with the price of silver is up 142%. Although these are considerably large increases in value in a very short period of time, compared to past price increases the current moves are in their infancy.
Posted in gold, gold bugs, Homestak Mining, HUI, Richard Russell, Silver, XAU
Tagged members


