Category Archives: interest rates

Interest Rate Monitor: June 2017

In our last posting on March 13, 2017, we said that the financial markets were widely anticipating that interest rates would increase.  However, we persist in the belief that the leading indication of interest rate direction comes from watching the direction of the 3-month Treasury, which is a market driven instrument.  As reflected in the chart below, we’re in for a bumpy ride ahead.

Continue reading

Interest Rate Monitor

The markets are anticipating an interest rate increase at the next Federal Reserve meeting on economic policy and many could legitimately say that this anticipation is what drives the short-term rates higher. 

However, history is on our side on this matter.  As pointed out in previous postings, Federal Reserve rate policy always follows the actions of short-term rates as demonstrated in the last comparable cycle in interest rates from 1953 to 1980.

image


NLO Interest Rate Monitor

On December 16, 2015, we published an article titled “Interest Rate Policy: Bizarre to the Uninitiated”.  In that hit job against the Federal Reserve, we said the following:

“The article [“Bizarre Theory That Says Fed Increases Will Fuel Inflation”] promotes the idea that the Federal Reserve somehow is on the leading edge of setting policy.  We don’t believe this to be the case.  In our November 2015 article on gold and interest rates, we said that market rate movements take place before the Federal Reserve takes action, rather than the other way around.”

In this piece, we track interest rates from the recent all-time lows and compare the Federal Reserve Bank Discount Rate to the 3-month Treasury Rates.  We will demonstrate how the Federal Reserve routinely follows the activity of market rates as reflected in the 3-month Treasury Rates.

image

Remember, The Discount Rate is the primary tool that the Federal Reserve is judged on in terms of it’s affect on the U.S. economy.  This excludes “emergency” measures such as ZIRP, TARP, TALF and QE∞.

The Nature of Market Booms and Busts

In a recent article on SeekingAlpha.com titled “The Bigger The Boom, The Bigger The Bust” by William Koldus, it was suggested that:

  • “…we have already forgotten the lessons that should have been learned in 2008.”
  • “Monetary policy makers have set the course for the next ‘Minsky Moment.’"
  • “A good dose of volatility in both the stock and bond markets would be good for all financial market participants.”

In our review of Koldus’ work, we’ll attempt to demonstrate that analysis on stock market history should not begin with evidence that is narrowly defined. Our introduction of secular trends in the market might help put current market moves into perspective.  We’ll also show that the Federal Reserve might not be as powerful as some might think.  Finally, we hope to demonstrate that a moving market, either up or down, is good regardless of the extent and timing.

Continue reading

Interest Rate Policy: Bizarre to the Uninitiated

On the heels of the first interest rate increase since 2006 we came an article from BloombergBusiness that should be of interest to everyone.  The article highlighted a “bizarre” theory that is quite logical and fits in well with our own long held beliefs.  That theory, touted by “Neo-Fisherians”, proposes that increasing interest rates might be what is needed to push inflation higher, as opposed to the established policy of lowering interest rates, a longstanding position of the Federal Reserve during times of crisis.

image

The article contained the following thoughts:

“Many economists are so perplexed by the lack of inflation in the U.S. after years of unprecedented monetary stimulus that a bizarre, century-old theory is suddenly gaining traction: Maybe higher interest rates are what’s needed to push up consumer prices.  The idea runs counter, of course, to basically everything taught in Economics 101 classes (higher rates, we’re told, discourage rather than encourage spending and therefore curb inflation).”

This idea of “running counter to basically everything taught in Economics 101” almost explains why it may be useful and necessary for application to the current economic environment.  For the most part, Economics 101 is primarily a set of theories that apply only if all other variables remain unchanged, which is usually never the case.  It should be noted that this potential shift in policy couldn’t become an idea in the mainstream thinking until all other possibilities have been exhausted.

The article promotes the idea that the Federal Reserve somehow is on the leading edge of setting policy.  We don’t believe this to be the case.  In our November 2015 article on gold and interest rates, we said that market rate movements take place before the Federal Reserve takes action, rather than the other way around.

image

In a comparable interest rate cycle, from 1948 to 1981, we can see that the discount rate followed each rise in the short-term rate.  Likewise, the most recent rate increase has followed a low and subsequent increase in the 3-month Treasury and the 10-year Treasury, as seen below.

image

Another challenge is with the article’s claim that “…higher rates will make people think the economy is doing better and, as a result, they’ll start spending more. In other words, project strength and strength (as well as a little inflation) will follow.”  This line of reasoning doesn’t fit with the reality of what happens. 

Short-term rate start to rise reflecting the view that the economy has improved which is followed by similar action by the Federal Reserve.  Rising rates reflect a growing sense, and reality, of increased inflation which consumers attempt to stay ahead of by spending more current dollars.  The spending of current dollars initially is about confidence in the economy.  However, the long-term impact in a rising inflation and interest rate environment, is that it quickly becomes about spending current dollars to beating inflation.

A single rate increase by the Federal Reserve in no way makes for a trend.  However, markets often lead the way and what initially seems “bizarre” is only a natural change in regime, a change that we haven’t seen since the early 1940’s.

Gold Stock Indicator: November 20, 2015

Gold and gold stocks continue to languish as there appears to be no catalyst to propel prices higher. 

image

The perception of no reason for gold to increase adds to the despondency of traders and investors which compels selling.  However, we’d like to point out that in spite of the conventional wisdom, the prospect of an interest rate rise is the biggest unambiguous reason for gold to increase in value.  While a Fed rate increase is what everyone is waiting for, history suggests that Fed policy  (government regulated) follows short-term Treasuries (market driven).

image

In a barely perceptible way, the chart above demonstrates that all Federal Reserve rate increases were preceded by a rise in the 3-month Treasury.  The blue arrows indicate the reversal in the declining trend before 3-month Treasuries increased.  From this point, we can easily see that the Federal Reserve’s discount rate follows to the upside not long after.  We’ve only included the point in the interest rate cycle that corresponds to the phase that we are entering, coming from an all-time low to an eventual all-time high.

The price of gold cannot sustain a rise in the face of deflationary forces, which typically brings interest rates down.  As the cycle eventually turns, we will see a sustained increase in the price of gold (with the obligatory volatility).  Analysts will argue that it is not possible for the price of gold to increase in the face of rising interest rates, however, the period from 1948 to 1981 is exactly when gold had its last massive bull market (based on foreign free market price of gold from 1948-1971; U.S. price of gold from 1971-1981).

Gold Stock Indicator

Utility Stocks and Rising Interest Rates

Every stock market investor should be concerned about the impact that rising interest rates might have on future investment returns.  The prevailing theory is that when interest rates rise then stock prices should decline due to the impact to earnings from higher borrowing costs.  Since we are at or near the lowest level in interest rates, conventional wisdom suggests that eventually interest rates will rise.

With rising interest rates, investors should expect that stock prices will decline as per share earnings are reduced.  One industry that borrows heavily for going operations is the utility sector (electricity, water, gas etc.).  This article will give a cursory examination of utility stocks from the beginning of a rising interest rate cycle to the peak (1939 to 1980).  We will attempt to determine if the conventional thinking on rising interest rates and their impact on utility stocks is correct.

The Myth of “Inflation Proof” Stocks

As the U.S. experiences record low interest rates, it becomes seemingly obvious that inevitably the next major move is up. What isn’t so obvious is what the impact would be on stocks. Some analysts can definitely see the forest from the trees on this matter. However, having this skill doesn’t automatically mean that navigating that forest is all that easy.
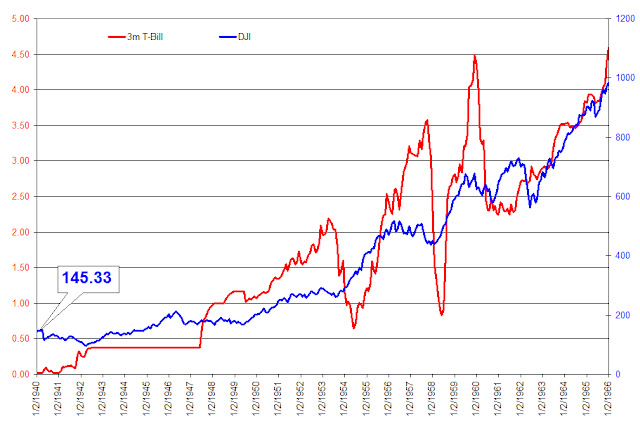
There are two important issues that must be brought to your attention about the forest and the trees in our current investing environment. The first matter (regarding the forest) about rising interest rates is that the bull market in stocks from 1940 to 1966 occurred while rates on 3-month T-bills went from 0.01% in January 1940 to 4.59% in January 1966. The chart below does a side-by-side comparison of rising rates and the Dow Jones Industrial Average. We’re certain that the pervasive thinking is that “this time is different.” However, we wouldn’t want this important fact to remain ignored or glossed over.

The second point (regarding the trees) is that even though inflation is most often represented in the rise of commodity prices, the best investment opportunities may not be in commodity related stocks. To demonstrate this point, we have selected six stocks to compare during a popularly known period of high inflation.

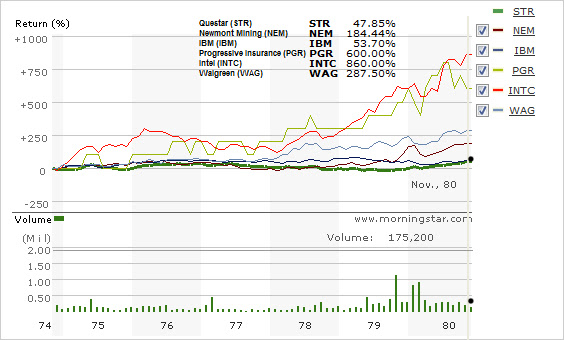
The stocks that we have selected for this comparison are Questar (STR), Newmont Mining (NEM), IBM (IBM), Progressive Insurance (PGR), Intel (INTC), and Walgreen’s (WAG). Two of the stocks are synonymously known as inflation hedges, Questar in the natural gas industry and Newmont Mining in the gold mining industry. The remaining four stocks are a cross-section of almost any economy with insurance, retail, microprocessors and computers being represented.

Unfortunately, our bias towards non-traditional inflation hedges is easily shown when we selected the period from November 1974 to November 1980. However, we wanted to show the performance of stocks, in general, at their lowest point so that there is little confusion about the outcome.

The chart below depicts the total return of all six stocks over the given period in time. Not surprisingly, the stocks most associated with being the best inflation hedge turned out to be among the worst performing. The best performing stock was Intel (INTC) with a gain of 860%. Not far behind Intel was Progressive Insurance (PRG) with a gain of 600%. Walgreen’s came in third with a gain of 287.5% followed by Newmont Mining (NEM) at 184.44% and IBM with 53.7%. Last among the stocks was Questar (STR) with a gain of 47.85%.

While some could rightfully contend that our approach is biased and our conclusions are flawed, we highly recommend that anyone who does their homework and compares the performance of almost any stock with a history of consecutive annual dividend increases to any commodity stock that existed back in the 1970 to 1980 period (on a total return basis), then you’ll be able to arrive at the same conclusions that we did in distinguishing the forest from the trees.

By the way, IBM does not have a long term history of consecutive annual dividend increases which might explain why it couldn’t keep pace in the 1970s.

Please revisit New Low Observer for edits and revisions to this post. Email us.