As the saying goes, “once something becomes mainstream the investment opportunity probably has passed.” In some instances, the magazine cover is the most recognized way to tell if a concept, idea or person has gone mainstream. But how do we know this is really the case? Except for the anecdotal evidence that fits someone fancy or the less than anecdotal evidence that was published here, there has been little proof to demonstrate that such a contrarian indicator is reliable or accurate.
The recent rise in the price of gold has many wondering if we have reached the stage where, as an investment theme, it has gone mainstream. Since July 1999, the average price of gold has risen from $255.81 to the most recent high of $1,900. For any commodity price to rise so much, let alone the dramatic increase in the stocks represented in that industry, should warrant some cause for concern.
As a contrarian indicator, we could look at the many magazine covers out there to make our determination of whether gold has gone mainstream. However, using such an indicator can take a lot of cover stories and a substantial amount of time before we eventually could consider ourselves correct. The number of missed opportunities and inaccurate calls for a market top would be many.
However, with the advent of keyword searches and proprietary databases, we can look at the historical significance of all mentions of gold. We have chosen to use the Proquest Complete database covering Barron’s from May 1921 until the present. Although this will likely include advertisements, we’re willing to believe that the increase in ads about gold would correspondingly increase when there is more interest in the precious metal. Not surprisingly, advertisers spend more when they shouldn’t and spend less when they should spend more.
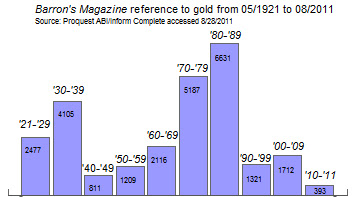
In the chart below we see, on a 10-year basis, the number of times that gold is mentioned in Barron’s from May 1921 until August 2011. For reasons that shall be explained, the decade of the 1930’s and 1980’s were periods when the number of gold mentions peaked.
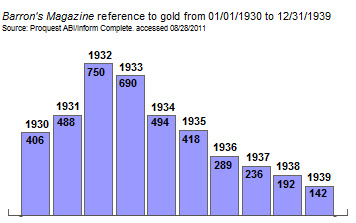
Our observation is that the peak in the number of mentions on the topic of gold occurred after major turning points in the price of gold. The bar chart below shows the decade of the 1930’s in greater detail. The year of 1932 shows the most articles written on gold. The decline in interest after 1932 reflects the herd mentality of diminished expectations for gold after England’s September 21,1931 departure from the gold standard.
The impact of England’s suspension of the gold standard led to a domino effect of countries abandoning the gold standard. Denmark, Norway and Sweden abandoned the standard by the end of the same month. In October 1931, Finland was next to go off the gold standard. Those that remained on the gold standard in Europe suffered huge losses due to the devaluation of their large holdings of British pounds in their treasury. The belief at the time was that the currency would always be backed by the set price of gold.

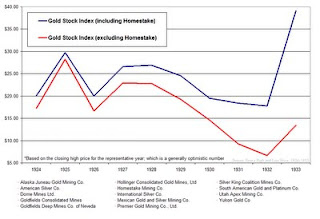
However, after many countries departed from the gold standard, the price of gold stocks began to bottom. With fewer articles on the topic of gold after 1932, the bull market in precious metal stocks was just beginning as demonstrated in the chart below of gold and silver stocks from 1924 to 1933.
During the financial crisis from 1929 to 1932, it seems as if gold was popular in Barron’s until it was no longer being propped by governments through the use of a gold standard. Once freely able to find a price, the process of gold stocks bottoming was inevitable.
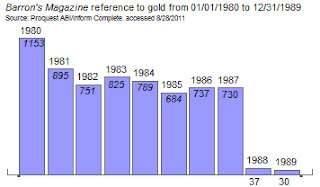
After the peak in the price of gold in 1979/1980, Barron’s was again late in the most mentions of gold. However, the period that followed the 1980’s peak in mentions of gold held at very high levels as the die-hard gold bugs were unwilling to accept the reality of the disinflationary environment that the world economy was entering.
In the chart below, we observed that a significant drop-off in mentions of gold after 1987 may have to do with the fact that gold stocks declined equally as much as the Dow in the same period of time. Since the decline in gold stocks couldn’t offset the losses of stocks as anticipated, anyone who would have claimed that gold stocks were a refuge during a declining market had all the evidence to demonstrate that such a notion was foolhardy.
In light of the fact that we believe that we’re in a secular bull market in gold stocks, as indicated in our 2010 article (found here) or in our September 2009 article on silver being the best play on the rise of gold (article here), our expectation is that the number of mentions in gold need to match the levels of 1980 or 1932 before we’d be concerned that the lagging contrarian indicator of Barron’s mentions of gold has any relevance on future long-term price declines in the metal and gold stocks.
Because we believe that gold stocks act like perpetual options on the price of gold, we’d select the gold stocks from the Philadelphia Gold and Silver Stock Index (XAU). The following are our top choices from the XAU index:
1. Freeport-McMoran (FCX)- Freeport-McMoRan is within 10% of the 52-week low and has a dividend payout ratio of 17%. The P/E ratio is at a modest level of 7 times earnings. Value Line indicates that FCX is selling at least 35% below historical fair value. Since 2004, FCX has traded up to its estimated fair value and then retrenched. Investors in FCX should expect to sell at the $62 level and rotate into other relatively underpriced gold stocks at that time.
2. AngloGold Ashanti (AU)- At the end of last year (2010) AngloGold's total reserves amounted to 71.2 million ounces. The stock is within 15% of the 52-week low and has a dividend payout ratio of 13%. The trailing P/E is 22 but they are expected to grow their earning next year, which brings their forward P/E to 9.5. According to Value Line, AU is trading only 6% below its historical fair value. Using the 5-year historical book value of 4 as a benchmark, the current book value of 3.8 suggests a 5% discount to the average.
3. Kinross Gold (KGC)- Kinross operates in hte Americas, Africa, and Russia. At the end of 2010, its proven reserves were 62.4 million ounces of gold, 90.9 million ounces of silver, and 1.4 billion pounds of copper. The stock is currently trading just 1.3x its book value. If the 5-year history is any measure, the stock should rise 77% and trade at 2.3x book value. The company continued to increase its dividend over the years. Started in 2008, Kinross paid $0.08 per share and now it pays $0.10. The current payout ratio of 10% along with current gold price implies that dividend increases maybe around the corner.
4.Gold Fields (GFI)- Gold Fields engages in acquisition, exploration, development, and production of gold. At the end of 2010, their gold equivalent reserves stood at 78 million ounces. The company's P/E of 40 is high and price-to-book ratio is fair. While the current dividend yield of 1.7% appears to be high for a gold stock, that dividend is heavily dependent upon the profitability of their business. GFI's dividend policy is to pay out 50% of its cash earnings depending upon investment opportunities.
5. Barrick Gold (ABX)- According to Value Line investment survey, Barrick Gold is fairly valued at 10 times cashflow. With an estimated 2011 cash flow of $6.10 per share, Barrick Gold (ABX) is selling 13.72% below fair value as of September 13, 2011. Despite having a low dividend yield, Barrick has a sustainable dividend payout ratio of 12%, allowing for a substantial decline in earnings if necessary.
Our ranking of the gold stocks above is strictly based on those that are closest to the low and part of the Philadelphia Gold and Silver Stock Index (XAU). Aggressive precious metal investors can also participate in the extremely popular SPDRGold Share (GLD) ETF or the highly volatile iShares Silver Trust (SLV) for greater potential gain and/or loss.
We believe that a correction in gold stocks, beyond the trading range that has been established in the XAU since October 2010, is still on the horizon. Therefore, we believe that these stocks and funds can be bought at lower prices.
Please consider donating to the New Low Observer. Thank you.


