Category Archives: msa

MSA Safety 10-Year Targets

Below are the valuation targets for MSA Safety Inc. (MSA) for the next 10 years. Continue reading

Lessons Learned From Our Worst Picks

In response to our “Worst Performing Picks” article, a reader asks:
“Is there some common trait among these 5 that, if known, could be used as a red flag or indicator not to repeat a future sub-optimal purchase?”
Touc’s response:
This is the payoff question and is worth its weight in your favorite commodity.
First and foremost, in four of the 5 stocks, we didn’t adhere to our own rules. One rule is to side-step stocks that have had recent cuts or no annual increase in the dividend. At the time, we didn’t wait to confirm if Masco (MAS) would increase the dividend in April 2008. Also, we didn’t wait to see what would happen after the dividend cut by Nucor (NUE) in March 2008. The concept of confirmation is incredibly important in Dow Theory, by ignoring this principle we cornered ourselves with bad recommendations.
What we should have done is wait one full year after the cut, or lack of an increase, to determine the viability of the company. Keep in mind that a cut in the dividend isn’t a death sentence. In fact, cutting the dividend might be the best management move to make. However, current shareholders of the company might abandon the stock if they have a policy to hold stocks with a steady dividend (as we advise investors to do.) We jumped the gun on Masco (MAS) and Nucor (NUE) when all the economic tealeaves were saying things weren’t looking good. I mean, how could we ignore the fact that a home building supplier and a steel maker were going to have some troubles with a declining housing market?
The next rule of ours that we violated was not issuing a sell on Illinois Tool Works (ITW) and American National Insurance (ANAT) after substantial gains in a short period of time. Illinois Tool Works (ITW) rose 9% in one month while American National Insurance (ANAT) rose 15% in less than one month. It is not that we want to be traders however, if the market gives you in one month what is considered to be the historical annual average gain over the last 100, 50, 25, and 10 years then we should thank our lucky stars and move on. In the 15 recommendations that were made in 2008, 10 were successful and exceeded the historical long-term market averages. We had nothing to prove yet we managed to allow these opportunities to get away from us.
On the matter of Mine Safety Appliance (MSA) there are no explanations for the reason this didn’t succeed. To think that we’d be 100% on the mark every time would be fooling ourselves. Mine Safety Appliance (MSA) was simply a bad recommendation on our part, that is, unless you bought the stock at substantially lower levels.
There are several points that must be made about our investment strategy. First, we’re trying to take responsibility for the recommendations that we make. We don’t want to make a recommendation and leave it hanging out there in the open without accountability. Too often we see Strong Buy, Buy, Accumulate, Strong Conviction, Hold, and Market Perform recommendations without the clarity that is needed for investors. Adding to the lack of clarity is the issue of the absence of sell recommendations. Our Investment and Speculation Observations are meant to alert an investor to start their own research. Our Sell recommendations are meant to alert investors that exceptional gains have been made, compared to the historical average, and that selling wouldn’t be the worst strategy. Although we issue sell recommendations, investors can clearly chose what they wish to do if they actually bought a stock that we issued an observation on.
We also want to demonstrate that what we’re doing is a matter of discipline that can be applied by anyone. We’d like to believe that what we’re doing is more than just randomness and luck. We’ll probably be proven wrong soon enough. However, until that time comes we’ll continue to gladly show our mistakes that happen to be exceptions that prove our rules.
When we make a recommendation, our goal is to buy the stock at a lower point than the recommended date. We assume that an investor or trader has to do some due diligence before deciding to invest in our recommendations. This means that if the stock ran up then don’t buy but if the stock fell since the recommendations and the fundamental attributes are intact despite the relatively low price then an acquisition of the stock might be in order.
Finally, we use the investment/speculative observation date and price as the worse case scenario for our recommendations. We hold ourselves to this as an objective measure of whether we’re making the right calls or not. If we’re right then great however, if we’re wrong then we modify the method. Since codifying our approach, as outlined in the About This Site section, we’ve had very little need to make changes. Make no mistake we’re ready and willing to change if necessary. So far we’re able to say that luck has been on our side for quite a while.
-Touc 
Email our team here.

Celebrating Market Gains by Reviewing Our Worst Performing Picks

While champagne glasses are being raised to celebrate the nearly 62% increase in the Dow Jones Industrial Average over the bottom that was reached on March 9, 2009 we’d like to outline some of our worst performing research recommendations as part of our former website at Dividend Inc. We’re not surprised at the markets rise as outlined in our article on SeekingAlpha.com titled “The Importance of Market Perspective” issued in February 2009. Our only concern now is how much further the market could go before a mild decline of 30% or so.
As you may know, even in the worst environment for investing in stocks (during 2008) we still made recommendations for investors to look out for as new investment opportunities. Of the 15 companies that we recommended in 2008, only five under-performed. However, anyone who actually put money in these five stocks might have lost a large portion of their assets if they didn’t sell early enough.
First on the list is Mine Safety Appliance (MSA) which fell 61.93% from the Research Recommendation date to the lowest point on March 9, 2009. Almost as soon as we made the recommendation the stock fell to $35 a share from $41.61. The stock moderated for a couple of months until it finally collapsed in early October. (MSA) discontinued its policy of increasing the dividend every year which is a warning sign for the future outlook on earnings. Adjusted for dividend payments, (MSA) is in the lose column to the tune of –32.19%.
Next on our list is Masco Corp. (MAS). (MAS) also took an incredible dip right after the recommendation. Falling from $19.43 all the way down to $14.00. After a rise all the way back to the recommendation level of around $19, (MAS) made the amazing march down 81.27% to the March 9, 2009 low. Because (MAS) is in the home improvement and building industry it stands to reason that the stock would fall as much as it did. Not surprisingly, (MAS) cut their dividend which for the New Low Observer teams means sell the stock and watch what develops from the sideline. Adjusted for dividend payments, (MAS) is in the lose column to the tune of –15.41% since the initial recommendation.
The next stock is Illinois Tool Works (ITW) which was a stock that was handled in the most irresponsible manner on our part. After recommending the stock on April 2, 2008 at $50.34, we were able to watch the stock exceed a gain of 9% in less than 2 months but didn’t put in a sell recommendation. Given what we knew about the market conditions at the time, we should have been more vigilant about the movement of this stock. Subsequent to our recommendation of ITW the company’s stock fell by as much as 49.15% at its worst and has discontinued it’s record of dividend increases. Adjusted for dividend payments since the recommendation date, ITW is in the lose column by –2.14%.
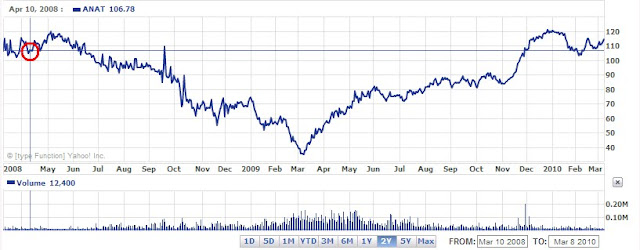
American National Insurance (ANAT), one of my favorite insurance companies has had an astounding run since our recommendation. ANAT initially rose 15% after our recommendation which was great. However, we didn’t adhere to our rule of taking exceptional gains in a short period of time. The price to pay for this error was to watch ANAT fall a gut wrenching 67.87% to the low of March 9, 2009. Even more astounding is the rise from the bottom however, we cannot take any credit for the rise that has taken place since. ANAT has discontinued its record of increasing the dividend every year. One claim that can be made is that since our recommendation date, ANAT has risen by 14.97% when adjusted for dividend payments.
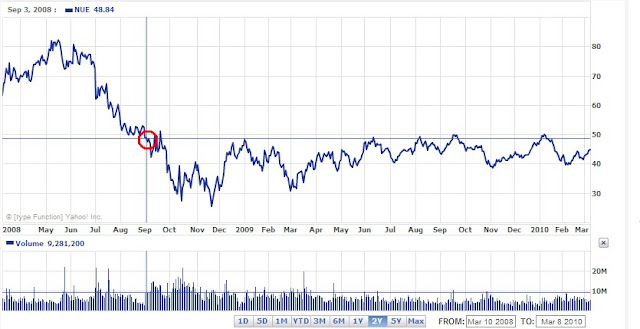
Finally, our recommendation of Nucor (NUE) fell by 47.75% at the lowest point on November 20, 2008. NUE later cut the dividend and has an adjusted lose of –2.97% since or initial recommendation.
It should be pointed out that our policy is to make Investment Observations at a time when we think a stock should be investigated as a potential investment opportunity. Our hope is that after the recommendation/observation the stock price will be lower than when we first pointed out the stock. If you review our 2008 Transaction Overview, you will see that we did carry a few of these stocks in our portfolio with varying results. Despite the fact that these companies cut or did not increase their dividend we will continue to follow these stocks as former Dividend Achievers.
-Touc
  • When things are going great, investigate and learn from the worst performing assets

A reader asks:
“Is there some common trait among these 5 that, if known, could be used as a red flag or indicator not to repeat a future sub-optimal purchase?”

Touc’s reply is here.

2008 Transaction Overview

Below are all of my closed transactions for 2008 with the percentage realized gain or loss along with the percentage of the portfolio of each position. Closed positions are those that were done after the purchase of the stock took place. Therefore, purchases that took place in 2007 may have been close in 2008 while purchases in late 2008 may not have reflected a gain or loss until 2009. As an example, FDO was purchased in late December 2007 and sold late January 2008.
After transaction costs, the total return in the portfolio for 2008 was 14.35%. The dividend yield received on the account was 2.53%, with the dividend accounting for 17.62% of the total change in the account value. I am open to questions about the rational for selecting a particular stock at a given time during 2008. One thing that will be noticed about the differences between 2008 and 2009 is that 2009 has far fewer transactions.
Because this portfolio actually made money when the major indices lost close to 40% in 2008, I'm hoping to replicated this approach (mainly to avoid losing money in a market downturn.) I would appreciate any constructive insights or thoughts by you the reader. I'm hoping this will be an instructive moment for everyone involved. If you don't wish to post in the comment section then send me an email.I will be posting my transaction history for 2009 here shortly.

-Touc
Symbol
Close date
Total % Gain % of Portfolio
(FDO)
 
1/31/2008
 
10.65%
 
96.67%
(WSC)
 
2/11/2008
 
-3.93%
 
94.28%
(AIG)
 
2/28/2008
 
12.52%
 
82.65%
(CTAS)
 
3/13/2008
 
-3.81%
 
29.43%
(CDE)
 
3/13/2008
 
-12.42%
 
1.91%
(BSC)
 
3/14/2008
 
7.33%
 
26.10%
(HTX)
 
3/24/2008
 
1.73%
 
29.52%
(KGC)
 
3/24/2008
 
-16.73%
 
38.15%
(CTAS)
 
4/16/2008
 
-4.34%
 
31.11%
(GSS)
 
4/16/2008
 
-13.21%
 
1.77%
(NC)
 
7/23/2008
 
27.30%
 
32.11%
(MSA)
 
8/11/2008
 
19.02%
 
36.71%
(WIN)
 
8/14/2008
 
5.55%
 
27.27%
(BGG)
 
8/27/2008
 
1.27%
 
31.38%
(ANAT)
 
9/9/2008
 
-11.64%
 
28.26%
(EXPD)
 
9/9/2008
 
-5.51%
 
33.01%
(HPQ)
 
9/9/2008
 
115.03%
 
0.07%
(NSEC)
 
9/9/2008
 
-17.36%
 
3.08%
(TDS)
 
9/9/2008
 
-3.97%
 
38.10%
(NEM)
 
9/17/2008
 
3.27%
 
32.03%
(HL)
 
9/18/2008
 
5.70%
 
39.06%
(AIG)
 
9/23/2008
 
33.94%
 
38.27%
(ANAT)
 
9/29/2008
 
2.80%
 
29.25%
(ADM)
 
9/30/2008
 
-8.43%
 
20.77%
(WAG)
 
9/30/2008
 
-1.75%
 
44.09%
(TMR)
 
10/7/2008
 
-14.66%
 
11.36%
(NXG)
 
10/7/2008
 
-12.72%
 
11.40%
(AEM)
 
10/10/2008
 
-3.03%
 
15.58%
(FNM)
 
10/10/2008
 
-46.25%
 
7.14%
(GSS)
 
10/10/2008
 
-8.66%
 
12.11%
(JOF)
 
10/14/2008
 
2.34%
 
22.18%
(DOG)
 
10/15/2008
 
1.14%
 
43.23%
(AIG)
 
10/20/2008
 
-2.55%
 
66.35%
(BMI)
 
10/22/2008
 
-5.40%
 
35.38%
(EUM)
 
10/27/2008
 
5.26%
 
46.63%
(AEM)
 
10/28/2008
 
-4.08%
 
25.83%
(ABX)
 
10/28/2008
 
-2.92%
 
24.26%
(CTL)
 
10/31/2008
 
-9.93%
 
34.18%
(NC)
 
10/31/2008
 
-0.14%
 
43.42%
(NC)
 
11/7/2008
 
-12.16%
 
49.47%