Category Archives: Nasdaq 100 Watch List

Nasdaq 100: 2011 Re-Rank Review

On December 9, 2011, the Nasdaq OMX Group announced the names of the companies that would be added and dropped from the Nasdaq 100 Index.  This year there were five companies added and dropped. 
The five companies added in 2011 were:

Fossil, Inc.
Avago Technologies Limited
Nuance Communications, Inc.
Hansen Natural Corporation
Randgold Resources Limited

The five companies dropped in 2011 were:

Illumina, Inc.
Qiagen N.V.
NII Holdings, Inc.
Urban Outfitters, Inc.
FLIR Systems, Inc.

From the following valuation metrics, the companies that are being added to the Nasdaq 100 appear more overvalued than those being dropped.
  • As a group, the stocks being added to the Nasdaq 100 Index have an average price-to-earnings ratio of 60x.  The average price-to-earnings ratio of the stocks being dropped is 21x.
  • The average price-to-book ratio for the companies being added is 5.23x while the price-to-book ratio for the stocks being dropped is 2.40x.
  • On average, the stocks being added are approximately 50% above their 52-week low while the stocks being dropped are only 12% above their 52-week low.
The theory is that the companies being added to the index will significantly improve their earnings enough to justify their high price-to-earnings ratio.  Combined with the expectation of higher earnings is a higher stock price.  However, from our cursory review of the performance of the companies added and then dropped from the Nasdaq 100 Index in 2010, the inclusion into the index hasn’t immediately translated in an increase of the stock price.
In the table below we show the 1-year performance of the seven companies added and dropped from the Nasdaq 100 in 2010.  This performance is based on the announcement of December 13, 2010 until the closing price of December 9, 2011.

Symbol
2010
2011
% change
Akami (added)
50.68
28.11
-44.53%
C-Trip (added)
44.53
23.2
-47.90%
Dollar Tree (added)
55.85
82.55
47.81%
F-5 Networks (added)
139.06
114.74
-17.49%
Micron (added)
8.14
5.89
-27.64%
Netflix (added)
183.8
70.89
-61.43%
Whole Foods (added)
48.63
69.11
42.11%
Average
-15.58%
Cintas (dropped)
27.36
30.43
11.22%
Dish Network (dropped)
16.95
25.83
52.39%
Foster Wheeler (dropped)
33.51
19.36
-42.23%
Hologix (dropped)
17.42
17.2
-1.26%
J.B. Hunt (dropped)
39.49
44.74
13.29%
Logitech (dropped)
19.88
8.36
-57.95%
Patterson Companies (dropped)
29.23
29.34
0.38%
Average
-3.45%
Nasdaq 100
2207.45
2318.68
5.04%
Dow Jones Industrial Average
11428.56
12184.26
6.61%
S&P 500 Index
1240.46
1255.19
1.19%

While not a rousing success for either group, the companies that were added to the Nasdaq 100 Index suffered three times the loss than occurred for the stocks that were dropped from the index.  Of the stocks that were added to the index, the non-tech related companies, Dollar Tree (DLTR) and Whole Foods (WFM), outperformed with gains of 48% and 40%, respectively.  This suggests that the “basics” will outperform in the coming year if the economy continues to experience stagflation.  We believe that the recent re-introduction of Hansen Natural (HANS) will be among the top performing stocks at the time of the next re-ranking of the Nasdaq 100.
On November 18, 2011 (found here), we provided 13 companies that we believed were possible candidates for being removed from the Nasdaq 100 Index.  We were able to identify three of the five companies that were dropped from the index. The characteristic that was most pronounced for the companies being dropped from the Nasdaq 100 Index was a market capitalization of $4 billion or less and 80% less average trading volume.
Because the Nasdaq 100 Index has outperformed most other indexes since inception, it appears that the success of the index has more to do with the companies that are able to remain on the index for a longer period of time rather than those that are added and dropped.
The Punchline:
  • Stocks added to the Nasdaq 100 in 2011 are overvalued
  • Stocks dropped from the Nasdaq 100 in 2011 are undervalued
  • Stocks added in 2010 performed worse than stocks dropped in 2010
  • Of companies added, Hansen Natural (HANS) is expected to perform above average
  • Companies that are added or dropped from the index reduce the performance of the index
  • Out of the 100 companies in the index, we correctly identified 60% of those that were dropped
  • Companies on the Nasdaq 100 for an extended period of time may provide the basis for the index’s exceptional long-term performance

Nasdaq 100: November 18, 2011

Below are the Nasdaq 100 companies that are within 10% of their respective 52-week lows. Stocks that appear on our watch lists are not recommendations to buy. Instead, they are the starting point for doing your research and determining the best company to buy. Ideally, a stock that is purchased from this list is done after a considerable decline in the price and rigorous due diligence.

Symbol Name Trade P/E EPS Yield P/B % from Low
CTRP Ctrip.com International, Ltd. $25.65 22.00 1.17 0 3.56 2.25%
BMC BMC Software, Inc. $35.59 14.58 2.44 0 4.06 4.30%
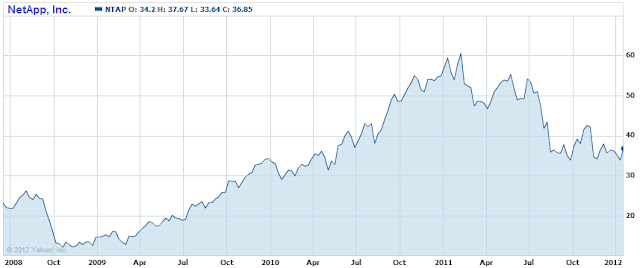
NTAP NetApp, Inc. $34.80 21.13 1.65 0 3.45 4.44%
QGEN Qiagen N.V. $13.74 24.98 0.55 0 1.26 5.29%
CHRW C.H. Robinson Worldwide, Inc. $66.13 25.73 2.57 1.70% 8.50 6.15%
NIHD NII Holdings, Inc. $23.41 13.21 1.77 0 1.20 6.47%
LIFE Life Technologies $37.65 19.76 1.91 0 1.50 6.66%
SIAL Sigma-Aldrich Corporation $60.01 16.67 3.60 1.10% 3.38 6.82%
BRCM Broadcom Corporation $32.81 19.75 1.66 1.00% 2.88 6.84%
MSFT Microsoft Corporation $25.31 9.20 2.75 3.00% 3.62 7.00%
RIMM Research In Motion Limited $18.46 3.37 5.48 0 0.98 8.34%
EXPD Expeditors Int'l of Wash. $42.84 23.67 1.81 1.10% 4.63 9.20%
SRCL Stericycle, Inc. $77.86 30.90 2.52 0 5.56 9.40%
HSIC Henry Schein, Inc. $60.97 16.01 3.81 0 2.21 9.76%
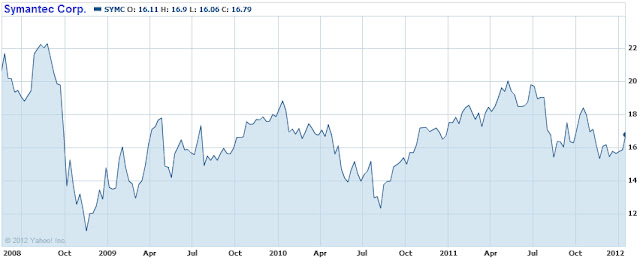
SYMC Symantec Corporation $16.20 18.43 0.88 0 2.62 9.76%
CA CA Inc. $20.47 12.01 1.70 0.90% 1.77 9.99%

Watch List Summary

On July, 11, 2011, it was announced that SiriusXM (SIRI) would be added to the Nasdaq 100 Index (article here).  Our view, at the time, was that adding SIRI to the Nasdaq 100 wasn’t the best idea.  Instead, we provided four stocks from the Nasdaq 50 alternative group which we felt could have been added to the index. 
Considering that we’re a month away from the Nasdaq 100 re-ranking, we’d like to see if the stocks that we suggested, from the Nasdaq 50 alternative list, actually did any better than SIRI.

symbol
company
15-Jul
18-Nov
% Change
SiriusXM
2.33
1.79
-23.18%
Dish Networks
30.77
24.74
-19.60%
Shire Plc
99.67
95.01
-4.68%
Nasdaq 100
2356.67
2253.95
-4.36%
Discovery Comm.
41.6
40.61
-2.38%
ASML Holdings
34.32
38.07
10.93%

As expected, SiriusXM was the stock that lost the most with a decline of -23.18% in the period from July 15th to November 18th.  In this period of time, SIRI’s P/E ratio improved as a result of increased earnings and total revenue along with a share price decline. The trailing price-to-earnings ratio (P/E ratio) contracted from 221 to the current level of 41. 
Serial bulls of SiriusXM (SIRI) contended that the P/E ratio would contract based on the expected improvement in earnings.  Unfortunately, an improved bottom line did not equate to the expected gains in the stock price.  The stock that was closest to SiriusXM (SIRI), in terms of losses, was Dish Networks (DISH) which declined -19.60%.  On the other end of the spectrum, ASML Holdings (ASML) gained +10.93% in the same period of time.
As the deadline for the re-ranking of the Nasdaq 100 approaches, We’re wondering if the Nasdaq 100 selection committee is willing to reconsider SIRI as a member of the Nasdaq 100 index.  Although we believe the stock should not be included in the index, we understand that membership is contingent upon volume and market cap considerations.  So far, SIRI meets the most basic requirements necessary to remain in the index.  However, if the carpet is pulled from under the stock by dropping SIRI from the index, a sizable decline in the price of SIRI is not out of the question.
In addition to the possibility of SIRI being removed from the Nasdaq 100, however remote, are the following companies:
  • Henry Schein (HSIC)
  • Stericycle (SRCL)
  • Sigma-Aldrich (SIAL)
  • Sears Holdings (SHLD)
  • Qiagen (QGEN)
  • Ctrip.com (CTRP)
  • NII Holdings (NIHD)
  • Warner Chilcott (WCRX)
  • Vertex Pharma. (VRTX)
  • BMC Software (BMC)
  • Life Tech. (LIFE)
  • Illumina (ILMN)
It is noted that many of the companies that are on our current Nasdaq 100 watchlist are also potential candidates for being removed from the Nasdaq 100 Index.  From prior observation, if for any reason these stocks aren't dropped from the index, they are expected to outperform the Nasdaq index by a sizable margin in the coming year.
Watch List Performance Review
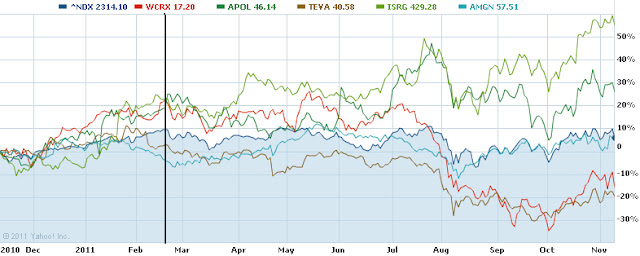
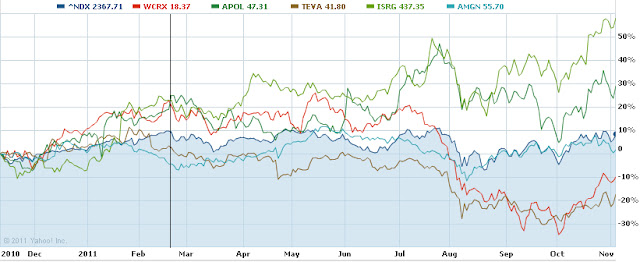
In our ongoing review of the Nasdaq 100 Watch List, we have taken the stocks from our list of November 10, 2010 (found here) and have checked their performance one year later. The companies on that list are provided below with the closing prices from November 10, 2010 to November 9, 2011.

Symbol Name 2010 2011
% Change
WCRX Warner Chilcott plc $20.89 $17.20 -17.66%
APOL Apollo Group, Inc. $36.84 $46.14 25.24%
TEVA Teva Pharma. $50.81 $40.58 -20.13%
ISRG Intuitive Surgical, Inc. $277.96 $429.28 54.44%
AMGN Amgen Inc. $54.93 $57.51 4.70%
Average gain 9.32%
NDX Nasdaq 100 2,187.74 2314.10 5.78%

The black line drawn in the month of February 2010 indicates the period when three of the five stocks had achieved annualized gains of at least 60% or more.  Taken as a whole, the entire portfolio achieved an annualized gain of nearly 40% near the middle of February 2010.  In the end, it was Apollo Group (APOL) and Intuitive Surgical (ISRG) that carried the top five to an average gain of 9.32% over the last year.  The top 5 beat out the Nasdaq 100 by 3.54%.

Nasdaq 100 Watch List: November 4, 2011

Below are the Nasdaq 100 companies that are within 15% of their respective 52-week lows. Stocks that appear on our watch lists are not recommendations to buy. Instead, they are the starting point for doing your research and determining the best company to buy. Ideally, a stock that is purchased from this list is done after a considerable decline in the price and rigorous due diligence.

Symbol Name Price P/E EPS Yield P/B % from Low
BMC BMC Software, Inc. 35.97 14.74 2.44 0 4.02 3.28%
RIMM Research In Motion Limited 18.97 3.46 5.48 0 0.99 4.63%
NIHD NII Holdings, Inc. 23.83 13.48 1.77 0 1.28 4.79%
QGEN Qiagen N.V. 13.81 25.11 0.55 0 1.24 5.82%
CHRW C.H. Robinson Worldwide 68.72 26.74 2.57 1.70% 8.91 10.30%
MSFT Microsoft Corporation 26.25 9.54 2.75 3.10% 3.76 10.99%
EXPD Expeditors Int'l of Was 44.21 24.43 1.81 1.20% 5.03 12.69%
SIAL Sigma-Aldrich Corporation 63.58 17.66 3.6 1.10% 3.59 13.17%
LIFE Life Technologies 40.08 21.04 1.91 0 1.6 13.54%
ILMN Illumina, Inc. 32.77 42.01 0.78 0 3.62 14.01%
FSLR First Solar, Inc. 49.59 8.14 6.09 0 1.03 14.31%
MYL Mylan Inc. 18.51 19.3 0.96 0 2.31 14.47%
VOD Vodafone Group Plc 27.92 11.59 2.41 6.90% 1.02 14.85%

Watch List Summary

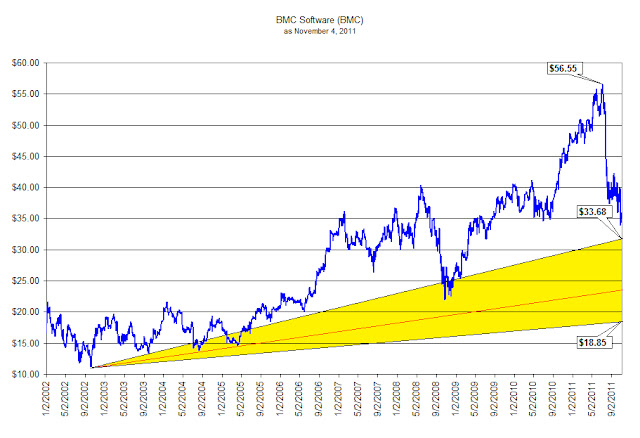
At the top our list this week is BMC Software (BMC).  Yahoo!Finance describes BMC Software (BMC) as a company that "develops software that provides system and service management solutions for enterprises in the United States and internationally."  According to Dow's Theory, BMC is considered fairly valued at $46.97.  Because we're technically in a bear market, our expectation is that $41.11, or 14.28%, is the upside target in the coming year.

Regarding downside targets, we're going to use Edson Gould's speed resistance lines.  Currently, BMC Software has a conservative downside target of $33.68 and an extreme downside target of $18.85.  The downside target of $18.85 is roughly 47% below the current price.  This is an acceptable level for where the stock could go and still be considered worth holding. 

In general the fundamentals for BMC seem strong. According to Value Line Investment Survey, BMC Software (BMC) has an upside target of $43.29 based on 2010 full year cashflow of $3.33. However, a strategy for accumulating the shares is necessary for any downside risk remaining.

Watch List Performance Review
In our ongoing review of the Nasdaq 100 Watch List, we have taken the stocks from our list of November 10, 2010 (found here) and have checked their performance one year later. The companies on that list are provided below with the closing prices from November 10, 2010 to November 4, 2011.

Symbol Company 2010 2011
change
WCRX Warner Chilcott
20.89
17.01
-18.57%
APOL Apollo Group
36.84
47.24
28.23%
TEVA Teva Pharma
50.81
40.93
-19.44%
ISRG Intuitive  Surgical
277.96
432.23
55.50%
AMGN Amgen
54.93
55.17
0.44%
Average return
9.23%
NDX Nasdaq 100 2187.74 2356.32
7.71%

The black line drawn in the month of February 2010 indicates the period when three of the five stocks had achieved annualized gains of 60% or more.  Apollo Group (APOL) and Intuitive Surgical (ISRG) had annualized gains of nearly 80% in the period covered.  Taken as a whole, the entire portfolio achieved an annualized gain of nearly 40% near the middle of February 2010.  In the end, it was Apollo Group (APOL) and Intuitive Surgical (ISRG) that carried the top five to an average gain of 9.23% over the last year.  The top 5 narrowly beat out the Nasdaq 100 by 1.52%, which is fine by us.

Nasdaq 100 Watch List: October 21, 2011

Below are the Nasdaq 100 companies that are within 20% of their respective 52-week lows. Stocks that appear on our watch lists are not recommendations to buy. Instead, they are the starting point for doing your research and determining the best company to buy. Ideally, a stock that is purchased from this list is done after a considerable decline in the price and rigorous due diligence.
Symbol
Name
Trade
P/E
EPS
Yield
P/B
% from Low
BMC Software, Inc.
38.55
15.23
2.53
N/A
4.05
3.66%
First Solar, Inc.
53.77
9.17
5.87
N/A
1.23
5.70%
Ctrip.com
32.35
28.01
1.16
N/A
4.46
6.80%
Qiagen N.V.
13.39
24.35
0.55
N/A
1.17
7.38%
Netflix, Inc.
117.04
29.7
3.94
N/A
17.53
8.74%
Express Scripts, Inc.
39.14
16.03
2.44
N/A
10.26
9.67%
Mylan Inc.
18.04
19.76
0.91
N/A
1.91
11.56%
Teva Pharmaceutical
39.16
11.2
3.5
2.00%
1.45
11.89%
Life Technologies
39.66
20.41
1.94
N/A
1.49
12.35%
Research In Motion
22.77
4.16
5.48
N/A
1.17
13.06%
NetApp, Inc.
38.1
23.13
1.65
N/A
3.64
14.35%
VeriSign, Inc.
30.88
6.88
4.49
N/A
N/A
14.37%
Urban Outfitters, Inc.
25.07
16.97
1.48
N/A
2.86
14.53%
Paychex, Inc.
28.78
19.58
1.47
4.60%
6.66
14.57%
Microsoft Corporation
27.16
10.1
2.69
2.90%
3.97
14.84%
Vodafone Group Plc
28.01
11.77
2.38
7.00%
1.03
15.22%
Microchip Tech.
33.8
15.61
2.17
4.20%
3.35
15.36%
Lam Research
40.61
7.01
5.79
N/A
2.01
16.29%
Expeditors Int’l of Wash
45.64
26.08
1.75
1.10%
5.03
16.34%
Marvell Tech.
13.14
10.55
1.25
N/A
1.61
17.01%
Gilead Sciences
41.47
12.44
3.33
N/A
5.27
17.61%
CA Inc.
21.97
13.22
1.66
0.90%
1.86
18.03%
DENTSPLY Int’l
34.11
17.86
1.91
0.60%
2.32
18.07%
Henry Schein, Inc.
65.8
17.5
3.76
N/A
2.32
18.45%
DIRECTV
46.42
15.3
3.03
N/A
N/A
18.66%
Applied Materials,
11.69
8.06
1.45
2.80%
1.75
18.68%
Dell Inc.
15.24
8.14
1.87
N/A
3.31
19.34%
eBay Inc.
32.12
24.13
1.33
N/A
2.56
19.58%
Symantec
18.42
22.77
0.81
N/A
2.95
19.92%
Fiserv
58.47
19.18
3.05
N/A
2.65
19.94%
Watch List Summary
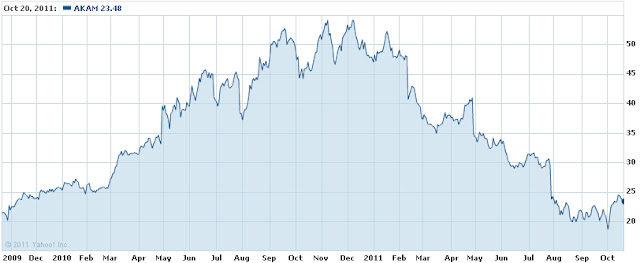
A stock that was on and off our radar in a flash was Akamai Technologies. Akamai Technologies (AKAM) was last on our Nasdaq 100 watch list August 12, 2011 (found here). Two months later, on October 3rd, Akamai closed at a 1-year low of $18.65. There are many reasons for AKAM’s price falling to a new low. Among other things, AKAM is under considerable competitive pressures, which some investors believe that the company has been slow to react to. However, every time AKAM reaches a new low, rumors abound about whether or not it will get acquired, as was the case 2 years ago. We believe that such rumors in 2009 is what helped those previously negative on the company to reconsider the merits of Akamai’s business model. Most recently it was rumored that Google was considering AKAM, although such rumors were dispelled very quickly.
Although Akamai has a lot of cash, potential growth in foreign markets, generally lower rate of customer turnover, which could contribute to the company’s growth going forward, we believe it is worth considering Akamai from a Dow Theory perspective for any upside potential that might remain for the company. According to Dow Theory, so far the average price paid by investors, as opposed to speculators, is $36.45. This indicates the point at which an investor, over the last year, considers to be the "fair value". This implies that the stock, at maximum could gain nearly 52% in due time. However, taking into account Charles H. Dow’s claim that in a bear markets, investors should only expect half of what would be considered “fair value” in a bull market, we think that in the next year Akamai could rise to the $30.15 level before faltering. We have acquired share of Akamai with the expectation that the stock will decline by at least 50%, at which point we will reconsider buying additional shares.
Watch List Performance Review
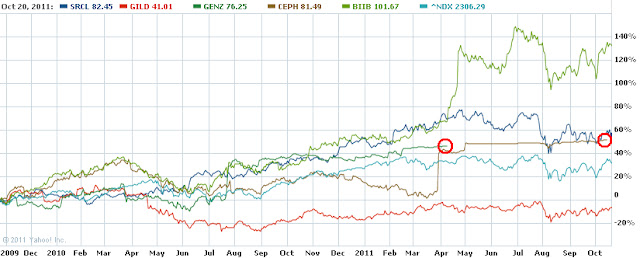
In our ongoing review of the Nasdaq 100 Watch List, we have taken the stocks from our list of October 23, 2009 (found here) and have checked their performance two years later. The companies on that list are provided below with the closing prices from October 23, 2009 to October 21, 2011.
-
-
2009
2011
change
SRCL
Stericycle
53.17
84.04
58.06%
GILD
Gilead
43.83
41.47
-5.38%
GENZ
Genzyme
54.5
76.25
39.91%
CEPH
Cephalon
54.02
81.49
50.85%
BIIB
Biogen
43.81
108.84
148.44%
-
-
-
Average change:
58.37%
-
-
-
-
-
^NDX
Nasdaq 100
1735.63
2306.29
32.88%

This is a particularly fascinating performance review because of the high performance of the stocks as compared to the Nasdaq 100 Index. On average, the stocks from October 23, 2009 list exceeded the Nasdaq 100 Index by 25.49%. Two of the companies have already been acquired (CEPH and GENZ) while SRCL and BIIB continue to outperform the Nasdaq 100 Index by a wide margin. The only stock that is severely lagging behind the index is Gilead Sciences (GILD) with a loss of -5.38% and a numbing -38.26% under-performance. Overall, we’re satisfied with the results of this watch list and encourage closer scrutiny of companies on our current list, there may be bargains to be had.

Please consider donating to the New Low Observer. Thank you.

Nasdaq 100 Watch List: October 7, 2011

Below are the Nasdaq 100 companies that are within 10% of their respective 52-week lows. Stocks that appear on our watch lists are not recommendations to buy. Instead, they are the starting point for doing your research and determining the best company to buy. Ideally, a stock that is purchased from this list is done after a considerable decline in the price and rigorous due diligence.

Symbol Name Price P/E EPS Yield P/B % from Low
ILMN Illumina, Inc. 27.18 31.39 0.87 0 4.25 0.00%
QGEN Qiagen N.V. 12.65 23 0.55 0 1.21 0.16%
BMC BMC Software, Inc. 36.98 14.61 2.53 0 4.39 1.01%
LIFE Life Technologies Corp. 36.82 18.95 1.94 0 1.56 4.31%
TEVA Teva Pharmaceutical 36.75 10.51 3.5 2.10% 1.41 5.00%
FSLR First Solar, Inc. 59.74 10.18 5.87 0 1.52 7.29%
PAYX Paychex, Inc. 27.11 18.44 1.47 4.70% 6.3 7.92%
VOD Vodafone Group Plc 26.25 11.22 2.34 7.30% 1.01 7.98%
URBN Urban Outfitters, Inc. 23.29 15.77 1.48 0 2.91 8.48%
GOOG Google Inc. 515.12 18.58 27.72 0 3.19 8.90%
NFLX Netflix, Inc. 117.21 29.74 3.94 0 19.38 8.90%
CTXS Citrix Systems, Inc. 54.94 31.09 1.77 0 3.93 9.42%
FISV Fiserv, Inc. 53.38 17.51 3.05 0 2.46 9.50%
VRSN VeriSign, Inc. 29.69 6.62 4.49 0 N/A 9.96%
HSIC Henry Schein, Inc. 61.09 16.25 3.76 0 2.21 9.97%
Watch List Summary
It appears that Illumina (ILMN) has come full circle since last appearing on our Nasdaq 100 Watch List on December 19, 2009 (found here).  At the time, Illumina (ILMN) traded at $27.88.  The stock rose as high as $79.40.  In our September 23, 2011 article (found here), as Illumina crept back onto our watch list at $41.67, we said, “while ILMN is still nearly 50% above the December 19, 2009 price, the possibility exists that all the gains that were made could disappear in short order.  Between our last posting and now, ILMN has managed to lose all of the gains that were accrued from December 2009.  We’re now actively accumulating shares of ILMN with the expectation that the share price will decline by approximately 50% from the current level.
Pharmaceutical Product Development (PPDI) has announced that they have accepted an all cash offer of $33.25 per share by the Carlyle Group and Hellman & Friedman (article here).  Pharmaceutical Product Development (PPDI) was on our September 11, 2009 watch list (found here).  Of the four companies on that list, only one has not been bought out.  Cephalon (CEPH), Genzyme (GENZ) and now Pharmaceutical Product Development Inc. (PPDI) have been acquired.  Although we’re not unaccustomed to stocks on either of our Dividend or Nasdaq 100 watch lists being bought, this is the first time that 75% of the companies on a single list were acquired by another institution.  We’d like to offer up the holdout, Stericycle (SRCL), to anyone willing to help us accomplish a grand slam.
Watch List Performance Review
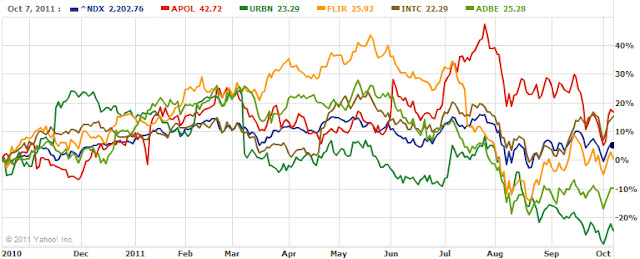
The following is a performance review of the Nasdaq 100 Watch List from October 18, 2010:

  •  Apollo Group, Inc. (APOL): +16.79%
  • Urban Outfitters, Inc. (URBN): -24.87%
  • FLIR Systems, Inc. (FLIR): +0.50%
  • Intel Corporation (INTC): +15.37%
  • Adobe Systems (ADBE): -9.97%
  • Nasdaq 100 (NDX): +5.01%
The performance of the five companies on the Nasdaq 100 list from last year underperformed the Nasdaq 100 by -5.45%.  Only two stocks, Apollo Group (APOL) and Intel (INTC) managed to eke out gains in the last year.  Apollo Group was a considerable surprise to us since we believed that the stock should have been dropped from the Nasdaq 100 at the time of the annual re-ranking of the index in December 2010.
Please consider donating to the New Low Observer. Thank you.

Nasdaq 100 Watch List: September 23, 2011

Below are the Nasdaq 100 companies that are within 5% of their respective 52-week lows. Stocks that appear on our watch lists are not recommendations to buy. Instead, they are the starting point for doing your research and determining the best company to buy. Ideally, a stock that is purchased from this list is done after a considerable decline in the price and rigorous due diligence.
Symbol Name Price P/E Div/Shr Yield P/B % from low
TEVA Teva Pharmaceutical 35.26 10.08 0.79 2.10% 1.33 0.74%
ESRX Express Scripts 38.71 15.86 0 0 10.55 0.91%
FISV Fiserv, Inc. 49.65 16.28 0 0 2.27 1.85%
NIHD NII Holdings, Inc. 29.73 12.08 0 0 1.36 2.02%
XRAY DENTSPLY 31.24 16.36 0.2 0.60% 2.13 2.49%
EXPD Expeditors Intl of Was 40.45 23.11 0.5 1.20% 4.52 2.98%
QGEN Qiagen N.V. 13.45 24.45 0 0 1.2 3.07%
VOD Vodafone Group P 25.08 10.72 1.92 7.60% 0.93 3.17%
PCAR PACCAR Inc. 34.06 17.29 0.72 2.00% 2.07 3.21%
NFLX Netflix, Inc. 129.36 32.82 0 0 20.22 3.47%
AMAT Applied Materials 10.59 7.3 0.32 2.90% 1.6 3.93%
URBN Urban Outfitters 23.41 15.85 0 0 2.76 3.95%
PAYX Paychex, Inc. 26.22 18.46 1.24 4.70% 6.27 4.38%
BMC BMC Software, Inc. 38.85 15.34 0 0 4.16 4.46%
RIMM Research In Motion 21.32 3.89 0 0 1.12 4.46%
JOYG Joy Global Inc. 65.01 11.84 0.7 1.00% 3.57 4.52%
INFY Infosys Limited 48.23 17.73 0.85 1.70% 4.33 4.58%
ILMN Illumina, Inc. 41.67 48.12 0 0 4.52 4.65%
VRSN VeriSign, Inc. 28.34 6.32 0 0 N/A 4.96%
Watch List Summary
The following are companies we are tracking from our watch list  this week. First up is Illumina (ILMN) which was last on our watch list on December 19, 2009. After being on our list, Illumina (ILMN) rose 172% at its peak on July 4, 2011. Already ILMN has lost -45.17% since the high in July. While ILMN is still nearly 50% above the December 19, 2009 price, the possibility exists that all the gains that were made could disappear in short order. As an example, anyone who bought ILMN after June 4, 2010 is confronted with a loss. ILMN has a market cap of $5.18B. Levered free cash flow at $146.48 million and enterprise value at $4.75 billion. The stock has lost -47.52% since the high on July 6th and is currently trading at 4.65% above its 52-week low.
Paychex (PAYX) was on our new low watch list on August 15, 2010 when it was within 2% of the 52-week low. Subsequently, Paychex (PAYX) rose 35.80% in 7 months. Employment being what it is, PAYX is trading in a wide range exhibiting a strong base at around $25. According to Value Line, PAYX is trading 30% below the historical fair value. PAYX has no debt and is likely to be an acquisition target if the stock remains at the current price or lower. Already PAYX has fallen 22% from the high set on March 9th bringing the market cap down to $9.49 billion. Prior to 2008, PAYX had a 19-year history of increasing the dividend. Since 2008, the annual dividend has remained at $1.24. PAYX would be purchased at any price below $25.50.
Netflix (NFLX) is going through significant turmoil as reflected in the stock price. Since the high of $298.73, NFLX has plummeted to $129.36 or down -56%. The financials on NFLX are a moving target making it difficult to fully determine the company’s true value. However, the business model is compelling and warrants considerable review. NFLX has a market cap of $6.8 billion and enterprise value of $6.65 billion. After applying Edson Gould’s 1/3 speed resistance line, NFLX will become worth considering at $99.58 and below. A detailed analysis of Gould's speed resistance line applied to NFLX can be found here.
Expeditors International of Washington (EXPD) has fallen to within 2.98% of the 52-week low. According to Yahoo!Finance, EXPD provides logistics services which involves consolidation or forwarding air and ocean freight. EXPD is a highly efficient organization and is trading at 2006 prices as if the company hasn’t averaged earnings of $1.32 in last 4 years compared to average earnings of $0.66 in the period from 2002 to 2005. According to Value Line Investment Survey, EXPD is estimated to have cash flow of $2 for 2011. Historically, EXPD has traded at 25 times cash flow which suggests that the stock should be selling at a fair value of $50. EXPD has increased their dividend every year for the last 18 years.
Watch List Performance Review
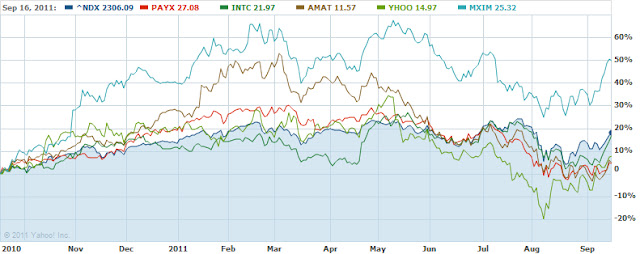
The performance of our watch list after one year is to remind us of the possible outcome of investing in the stocks on our list. It is hoped that we can gain greater insight in the investing process and refine that process as we go along. Below is the performance of the top five stocks on our Nasdaq 100 watch list from September 17, 2010.
Symbol Name 2010 2011 % change
PAYX Paychex, Inc. 25.95 26.22 1.04%
INTC Intel Corporation 18.81 22.16 17.81%
AMAT Applied Materials, Inc. 11.02 10.59 -3.90%
YHOO Yahoo! Inc. 13.89 14.71 5.90%
MXIM Maxim Integrated Products 16.91 23.89 41.28%
Avg. 12.43%
NDX Nasdaq 100 Index 1955.83 2206.86 12.83%

All of the top five stocks from last year achieved 25% returns by May 2011.  However, only Maxim Integrated (MXIM) was able to sustain it's price performance that was above the Nasdaq 100 throughout the year.  As a group, the top five fell short of the Nasdaq 100 by -0.40%.

Nasdaq 100 Watch List: August 12, 2011

Below are the Nasdaq 100 companies that are within 10% of their respective 52-week lows and ranked by highest dividend yield. Stocks that appear on our watch lists are not recommendations to buy. Instead, they are the starting point for doing your research and determining the best company to buy. Ideally, a stock that is purchased from this list is done after a considerable decline in the price and thorough due diligence.
Symbol Name Trade P/E EPS Yield P/B % from Low
INFY Infosys Limited 53.78 19.77 2.72 1.60% 4.97 2.56%
ATVI Activision Blizzard, Inc 10.71 19.76 0.54 1.50% 1.16 2.98%
LIFE Life Technologies 38.42 19.77 1.94 0 1.53 3.36%
NIHD NII Holdings, Inc. 36.9 14.99 2.46 0 1.66 4.44%
AMGN Amgen Inc. 50 10.4 4.81 2.30% 1.79 4.91%
FLIR FLIR Systems, Inc. 23.66 18.05 1.31 1.00% 2.31 6.29%
ADBE Adobe Systems 24.1 12.91 1.87 0 2.2 6.31%
PCAR PACCAR Inc. 36.84 18.7 1.97 2.00% 2.27 6.84%
WCRX Warner Chilcott plc 17.25 36.7 0.47 0 159.35 7.41%
MSFT Microsoft Corporation 25.1 9.33 2.69 2.50% 3.7 7.63%
QGEN Qiagen N.V. 15.12 27.49 0.55 0 1.33 8.08%
LLTC Linear Technology 27.47 10.99 2.5 3.50% 12.58 8.11%
PAYX Paychex, Inc. 26.66 18.77 1.42 4.70% 6.41 8.11%
AKAM Akamai Technologies 22.55 22.48 1 0 1.86 8.94%
MU Micron Technology, Inc. 6.18 9.78 0.63 0 0.75 9.38%
ADSK Autodesk, Inc. 29.18 28.3 1.03 0 3.79 9.58%
CHRW C.H. Robinson Worldwide 68.4 27.36 2.5 1.80% 8.49 9.79%
ESRX Express Scripts, Inc. 46.69 19.13 2.44 0 12.43 9.86%

Watch List Performance Review

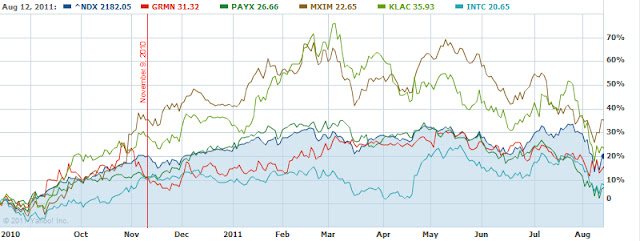
In our ongoing review of the Nasdaq 100 Watch List, we have taken the top five stocks on our list from August 15, 2010 and have checked their performance one year later. The top five companies on that list can be seen in the table below.

Symbol Name 2010 2011 % change 11/9/2010 approx. annualized gain
GRMN Garmin Ltd. 27.05 31.32 15.79% 10.94% 37.68%
PAYX Paychex, Inc. 24.97 26.66 6.77% 11.21% 38.61%
MXIM Maxim Int. 16.75 22.65 35.22% 35.28% 121.50%
KLAC KLA-Tencor 29.10 35.93 23.47% 28.59% 98.45%
INTC Intel Corp. 19.15 20.65 7.83% 10.50% 36.14%
Average 17.82% 19.31% 66.48%
^NDX Nasdaq 100 1818.80 2182.05 19.97% 19.69% 67.79%
The top 5 companies on our list last year underperformed the Nasdaq 100 by a narrow margin.  However, in the chart above, you'll notice that all 5 stocks achieved 10% gains within 3 months (our ideal target for selling) of the August 15th posting,  If all the stocks were bought after the posting and sold on November 9, 2010, as noted above, the gains would have approximated nearly 66% annualized returns.  We cannot emphasis enough the value of selling stocks if a 10% gain is accomplished within a year while inside of a tax-deferred account.  As you can see, the year end results vastly differ from the gains that could have been made.

Please consider donating to the New Low Observer. Thank you.

Nasdaq 100 Watch List: July 1, 2011

Below are the Nasdaq 100 companies that are within 20% of the 52-week low. This list is strictly for the purpose of researching whether or not the companies have viable business models. These companies are deemed highly speculative unless otherwise noted.
Symbol
Name
Trade
P/E
EPS (ttm)
Yield
P/B
% from low
Akamai Technologies
31.62
33.46
0.95
N/A
2.66
0.13%
Cisco Systems, Inc.
15.94
12.44
1.28
1.60%
1.82
1.06%
Urban Outfitters, Inc.
28.88
18.92
1.53
N/A
3.42
3.27%
Staples, Inc.
15.94
12.94
1.23
2.60%
1.55
8.03%
Teva Pharmaceutical
48.9
13.15
3.72
1.70%
1.87
9.01%
Marvell Technology
15.16
12
1.26
N/A
1.84
9.30%
Qiagen N.V.
19.12
32.97
0.58
N/A
1.75
13.40%
Activision Blizzard, Inc
11.86
27.45
0.43
1.40%
1.32
14.92%
Microsoft Corporation
26.14
10.39
2.52
2.50%
4.1
15.00%
Broadcom Corporation
34.65
17.48
1.98
1.10%
3.13
15.89%
Infosys Limited
65.81
25.12
2.62
1.30%
6.09
16.01%
Amgen Inc.
58.35
12.13
4.81
N/A
2.18
16.10%
Yahoo! Inc.
15.38
18.07
0.85
N/A
1.53
18.86%
Google Inc.
517.65
20.1
25.75
N/A
3.34
19.38%
Watch List Summary
Micron Technology (MU)
On February 3, 2011 in Barron’s magazine (article here), Doug Freedman of Gleacher & Co. upgraded his ratings of Micron Technology (MU) from Neutral to Buy. The justification for the ratings upgrade was that price-cutting within the respective industries for both companies was diminishing. At the time, Micron Technology was trading just short of the 52-week high at $10.89. Soon after the buy recommendation in early February, Micron Technology stock reached a peak of $11.61 by the middle of the month.
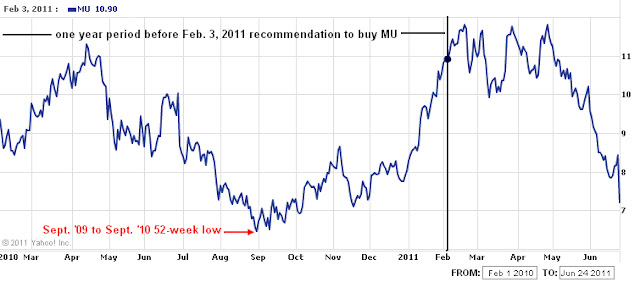
Fast-forward to June 24, 2011 in Barron’s magazine (article here), Freedman reiterates his buy rating of Micron Technology (MU). The reiteration of the buy recommendation comes after Micron’s stock fell to $7.39 per share or –32% since his original buy recommendation on February 3, 2011. Apparently there is a story not worth repeating that Freedman is sticking to regardless of the reality that such a story is not applicable to Micron (MU). Freedman’s initial buy rating came when the stock was within striking distance of a 52-week high. The idea of transitioning from a neutral rating to a buy rating at the high seemed illogical since it was based on the premise that the previous trajectory would continue unabated.
Pre-Market Rules the Trading Day
On June 27, 2011, the stock market trading for the Nasdaq 100 was ruled by the pre-market. What do we mean by the pre-market ruling the day? Well, with all of the volume that is created during the regular hours of trading, the most impact to stock prices occurs during the pre-market. On average, the pre-market trading moved the shares of Nasdaq 100 stocks by 96.95%. The regular hours of trading only impacted market gains by 3.05%.
In addition, the volume of the pre-market is dwarfed by the regular hours however there is little to show for all of the activity during the regular trading day. As an example, Apple (AAPL) had pre-market volume of 125,033 shares and a gain of $5.96. At the close of regular trading, AAPL closed at $5.69, only a 4% difference from the pre-market close. This 4% difference from the pre-market close occurred on 12 million shares of volume. 32% of the companies on the Nasdaq 100 had no change in price after the pre-market closing price was established. Micron Technology, which had 34 million shares traded, was among those companies that didn’t budge from the pre-market closing price. This activity is not relegated to just the Nasdaq 100 on June 27th, we’ve examined this topic at great length in the past at the following link.
Garmin (GRMN) Top Formation Complete
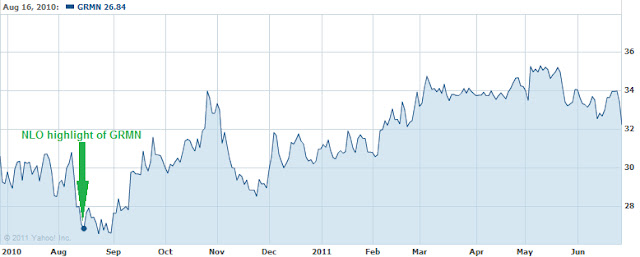
On June 28, 2011, navigation device maker TomTom announced that expected earnings and sales would be cut for 2011. This resulted in a 26% decline in the share price of TomTom. Garmin (GRMN) was soon to follow the lead of TomTom falling by 3% in pre-market trading. Garmin was highlighted as one of the Nasdaq 100 stocks to watch when it was within 2% of the 52-week low on August 15, 2010.
With a gain of 19% in 10 months and the prospect of retracing back to the $29 level, selling Garmin now, if you haven’t done so already, shouldn’t be out of the question.
Akamai (AKAM) in Lock Step
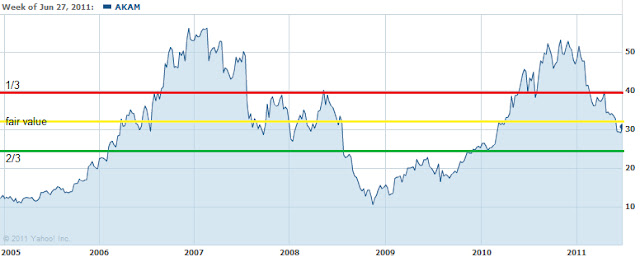
The price action of Akamai (AKAM) seems to be following in lock step the price movement from 2005 to 2008. In the period from 2005 to 2007 the stock of Akamai rose from $10 to as high as $59.15. The subsequent declining phase lasted from early 2007 to late 2008 and stopped at $9.29.
Where do we think that Akamai is in the current cycle of decline? The most recent high was registered at $54.12 on December 7, 2010. In the last cycle, the price of Akamai stock took a break from freefall by resting at the $25.88 level. If Akamai were to do exactly what occurred the last time around (on a percentage basis), then there should be a rebound to the Dow Theory 1/3 (red line) support line of $39.18.
In the last cycle, Akamai traded in a Dow Theory line formation two times as investors and traders decided which position held the strongest hand. The first time occurred in 2006. It only took investors four months to decide that the stronger hands were the accumulators of Akamai stock. The second time a Dow Theory line started was in mid-2007. After a year of struggle it was finally determined that the distributors of Akamai stock had the strongest hand.
If we’re lucky, with Akamai (AKAM) continuously falling to a new low, the recent reversal in the stock price could ignite a price rise back to the 1/3 (red line) Dow Theory resistance level of $39.18. Akamai’s stock price getting above $31.71 (yellow line) represents fair value, a significant marker in terms of Dow Theory since it indicates where a majority of investors, as opposed to speculators, have gains in their AKAM position instead of loses. This gives less incentive to the investors to sell their stock.
As in the last cycle for Akamai, the strongest resistance level is at the $39/$40 level. Dow Theory stipulates that an investor should only expect half of what is foreseeable down the road. Since $39.18 (red line) is the foreseeable prospect for AKAM, if the price is now $35, then a fair profit could only be 5.97% or a gain of $2.09. Trite as this may seem, it is the only reasonable expectation for the stock in the short term.
The downside target for Akamai (AKAM), according to Dow Theory, is $24.24 (green line). In the past, AKAM has shown the ability to break through this support levels on downside moves in resounding fashion. Those interested in taking new positions should be willing to accept the downside risks beforehand.
First Solar (FSLR)
It was reported on June 30, 2011 that First Solar (FSLR) received $4.49 billion in conditional loan guarantees from the Department of Energy. This news pushed the price of FSLR up 6% in after hours trading.
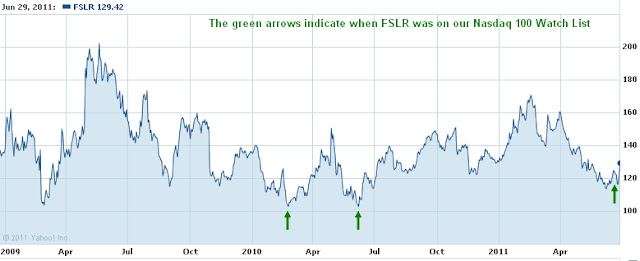
As the above chart indicates, First Solar (FSLR) appeared on our watch list several times at opportune prices. On February 26, 2010, FSLR appeared on our watch list when the stock price was within 7% of a new low. After a brief rise in the price of FSLR low in February, the stock re-appeared on our May 22, 2010 watch list falling within 16% of the 52-week low. More recently, FSLR showed up on our watch list when the stock came within 7% of the new low on June 17, 2011.

Watch List Performance Review

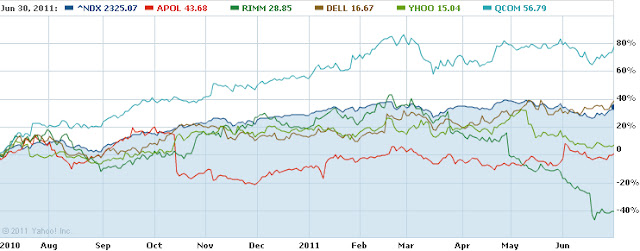
In our ongoing review of the Nasdaq 100 Watch List, we have taken the top five stocks on our list from July 2, 2010 and have check their performance one year later.

Symbol Company 2010 2011
% change
APOL Apollo Group, Inc. 41.86 46.6
11.32%
RIMM Research In Motion 48.14 28.83
-40.11%
DELL Dell Inc. 12.03 16.95
40.90%
YHOO Yahoo! Inc. 14.07 15.44
9.74%
QCOM QUALCOMM 32.37 57.81
78.59%
- - - Average 
20.09%
NDX Nasdaq 100 1734.41 2362.25
36.20%

Only two companies, Dell (DELL) and Qualcomm (QCOM), from our July 2010 watch list were able to beat the Nasdaq 100.  The average gain for the top 5 companies was 20.09% which was far below the 36.20% gain for the Nasdaq 100.  Apollo Group (APOL) provided a surprising gain of 11.32% in an extremely challenging environment for companies in the for-profit education business. Research In Motion (RIMM) not only was at a new low last year, it fell another -40%.  It seems that RIMM is going in a death spiral since few companies on our watch lists are near their two consecutive years in a row, let alone falling an additional -40%.  Despite the plummeting of the shares of RIMM, it should be noted that the stock rose 40% by March 2011 after showing up on our list last year.  
Disclaimer:
On our current list, we excluded companies that have no earnings. Stocks that appear on our watch lists are not recommendations to buy. Instead, they are the starting point for doing your research and determining the best company to buy. Ideally, a stock that is purchased from this list is done after a considerable decline in the price and extensive due diligence. We suggest that readers use the March 2009 low (or the companies' most distressed level in the last 2 years) as the downside projection for investing. Our view is to embrace the worse case scenario prior to investing. A minimum of 50% decline or the November 2008 to March 2009 low, whichever is lower, would fit that description. It is important to place these companies on your own watch list so that when the opportunity arises, you can purchase them with a greater margin of safety. It is our expectation that, at the most, only 1/3 of the companies that are part of our list will outperform the market over a one-year period.

.

Please consider donating to the New Low Observer. Thank you.
Nasdaq 100 Watch List: June 17, 2011

Below are the Nasdaq 100 companies that are within 20% of the 52-week low. This list is strictly for the purpose of researching whether or not the companies have viable business models. Although these companies are very risky, they provide significant opportunity to outperform the market in the coming year.
Symbol Name Trade P/E EPS Yield P/B % from low
URBN Urban Outfitters, Inc. 28.27 18.53 1.53 0.00% 3.44 0.60%
MRVL Marvell Technology 13.79 10.92 1.26 0.00% 1.72 0.95%
CSCO Cisco Systems, Inc. 15.05 11.75 1.28 1.60% 1.76 1.83%
RIMM Research In Motion 35.33 5.57 6.34 0.00% 2.06 1.90%
SPLS Staples, Inc. 15.05 12.23 1.23 2.70% 1.48 2.03%
AKAM Akamai Technologies 29.47 31.19 0.95 0.00% 2.49 2.72%
MSFT Microsoft 24.00 9.53 2.52 2.70% 3.78 5.57%
BRCM Broadcom 31.77 16.03 1.98 1.10% 2.95 6.25%
TEVA Teva Pharmaceutical 47.76 12.84 3.72 1.60% 1.85 6.46%
FSLR First Solar, Inc. 118.83 16.96 7.01 0.00% 2.87 6.67%
ATVI Activision Blizzard, Inc 11.10 25.69 0.43 1.50% 1.25 7.56%
INFY Infosys Technologies 61.64 23.53 2.62 1.40% 5.75 8.66%
QGEN Qiagen N.V. 19.16 33.03 0.58 0.00% 1.77 13.64%
YHOO Yahoo! Inc. 14.78 17.36 0.85 0.00% 1.5 14.18%
GOOG Google Inc. 500.37 19.43 25.75 0.00% 3.3 15.39%
AMGN Amgen Inc. 58.34 12.13 4.81 0.00% 2.18 16.08%
LLTC Linear Technology 31.51 13.36 2.36 3.00% 18.15 16.57%
PCAR PACCAR Inc. 46.12 29.01 1.59 1.00% 2.98 19.48%

 Watch List Performance Review

The performance of our watch list after one year is to remind us of the possible outcome of investing in the stocks on our list.  It is hoped that we can gain greater insight in the investing process and refine that process as we go along. 
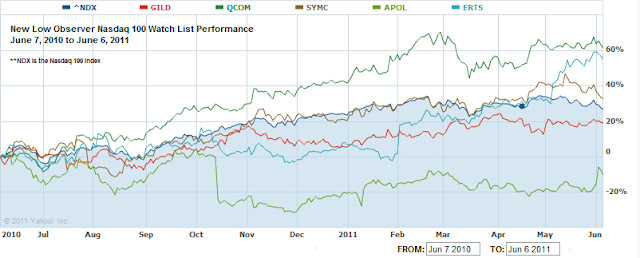
Below is the performance of the top five stocks on our Nasdaq 100 watch list from June 6, 2010 of last year.
Symbol Name 2010 2011 % change
GILD Gilead Sciences, Inc. 34.71 40.91 17.86%
SYMC Symantec Corporation 13.92 18.44 32.47%
ERTS Electronic Arts Inc. 15.81 23.8 50.54%
APOL Apollo Group, Inc. 51.48 44.71 -13.15%
QCOM QUALCOMM 35.3 56.48 60.00%
Average 29.54%
^NDX Nasdaq 100 1832.04 2274.48 24.15%

As a group, the top five from our list last year did fairly well by exceeding the index by more than 5%.  The only stock to decline was Apollo (APOL). Qualcomm (QCOM) was clearly the standout in the performance ranking of our watch list.  Likewise, Electronic Arts (ERTS) managed to crank out returns just north of 50% in the last year. 
It is important to note that, at the time, these stocks were not favored very highly in terms of expected growth of the stock price.  In fact, as our watch list was being posted in June 2010, many Wall Street analysts were actively downgrading these stocks.  Considering that the entire list from last year gained an average return of 21.51%, the outcome was quite reasonable.
    
Please consider donating to the New Low Observer. Thank you.

Nasdaq 100 Watch List: May 21, 2011

Below are the Nasdaq 100 companies that are within 19% of the 52-week low. This list is strictly for the purpose of researching whether or not the companies have viable business models. Although these companies are very risky, they provide significant opportunity to outperform the market in the coming year.

<> 

Symbol
Name
Price
P/E
EPS
Yield
P/B
% from low
Staples, Inc.
$16.37
13.53
1.21
2.40%
1.72
0.00%
Cisco Systems, Inc.
$16.53
12.9
1.28
1.40%
1.94
1.16%
Research In Motion
$43.52
6.86
6.34
0.00%
2.58
2.33%
Marvell Technology
$14.34
10.7
1.34
0.00%
1.72
3.39%
Microsoft Corp.
$24.49
9.73
2.52
2.60%
3.9
7.74%
Akamai Tech.
$34.20
36.19
0.95
0.00%
2.76
8.30%
Urban Outfitters
$31.51
20.65
1.53
0.00%
3.96
8.54%
Teva Pharmaceutical
$49.87
13.41
3.72
1.60%
1.94
11.17%
Broadcom Corp.
$33.51
16.91
1.98
1.10%
3.12
12.07%
Activision
$11.60
26.85
0.43
1.40%
1.32
15.88%
Infosys
$62.91
24.01
2.62
0.70%
5.85
18.07%
Qiagen
$20.05
34.57
0.58
0.00%
1.87
18.92%


Watch List Summary

Is Staples (SPLS) going to add one more notch to the Stadium Effect theory (pdf link)?  This theory says that after a company acquires the naming rights to a major league sports team, the stock of such a company typically underperforms the market (if it doesn't go out of business altogether).  Staples (SPLS) is at the very low as of the close of market on Friday May 20, 2011.  We're not bold enough to jump on board this stock at the moment, and this is saying a lot for a couple of guys who relish purchases at a new low.

Watch List Top 5 Performance Review

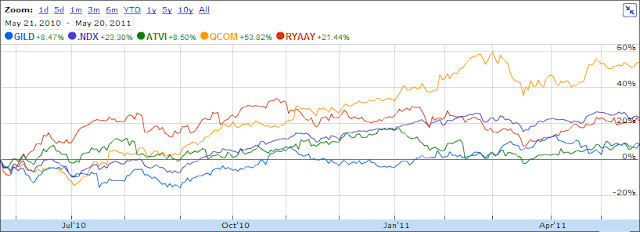
In our review of the watch list dated May 21, 2010, we found that all the stocks had gains while three of the top 5 outperformed the Nasdaq 100.  Qualcomm (QCOM), Gilead Sciences (GILD) and Genzyme (GENZ) was among our favorites at the time the list was published.  Ryanair (RYAAY) was a surprise to us since the airline industry is known for failure and bankruptcy.

Symbol Name 2010 2011 gain/loss
GILD Gilead Sciences 36.57 40.98 12.06%
RYAAY Ryanair 23.14 30.02 29.73%
QCOM QUALCOMM 35.89 57.38 59.88%
ATVI Activision 10.24 11.6 13.28%
GENZ Genzyme 49.41 acquired 51.02%
Average gain 33.19%
^NDX Nasdaq 100 1822.77 2351.43 29.00%
percentage change in chart is approximate only


In the News
We couldn't help but notice the article from Barron's titled "Price War Brewing on Cigarettes?" and the Seeking Alpha article titled "Cigarette Stocks Burning Up to New Highs." 
The Barron's article suggests that margins will be squeezed as competition for market share increases.  the companies mentioned by Barron's are Imperial Tobacco (ITYBY), Philip Morris (PM), British American Tobacco (BTI) and Altria (MO).
The SeekingAlpha article says that despite the fact that cigarette stocks are at a new high, there is still room to grow on the upside.  The companies mentioned in the Seeking Alpha are Lorrillard (LO), Altria (MO), Philip Morris (PM) and Reynolds American (RAI).   
We're on the side of Barron's.  As a price war breaks out, the earnings will be lower than expected and that will translate in a decline in the stock price.  We'll check back a year from now to see what the performance of the cigarette manufacturers look like.

Please consider donating to the New Low Observer. Thank you.

Nasdaq 100 Watch List: April 29, 2011

Below are the Nasdaq 100 companies that are within 19% of the 52-week low. This list is strictly for the purpose of researching whether or not the companies have viable business models. Although these companies are very risky, they provide significant opportunity to outperform the market in the coming year.

Symbol Name Price P/E EPS Yield P/B % from Low
AKAM Akamai Tech. 34.43 38.09 0.9 - 2.99 1.41%
TEVA Teva Pharma. 45.73 12.48 3.66 1.90% 1.89 1.94%
CSCO Cisco Systems 17.52 13.25 1.32 1.40% 2.1 6.05%
URBN Urban Outfitters 31.47 19.67 1.6 - 3.71 8.41%
MRVL Marvell Tech. 15.43 11.51 1.34 - 1.89 11.21%
AMGN Amgen Inc. 56.85 11.82 4.81 - 2.13 13.11%
ATVI Activision Blizzard 11.38 34.48 0.33 1.40% 1.34 13.91%
MSFT Microsoft 25.92 11.06 2.34 2.50% 4.63 14.03%
RIMM RIMM 48.65 7.67 6.34 - 3.3 14.39%
APOL Apollo Grp 40.03 15.07 2.66 - 4.34 18.61%

Watch List Summary

The deck has been reshuffled since our last Nasdaq list from April 15th.  New to our list are RIMM (RIMM) and Activision (ATVI).  There are five companies that are no long on our watch list.  Those five companies are Intel (INTC), Staples (SPLS), Infosys (INFY), Celgene (CELG) and Qiagen (QGEN).  Are these the next over-performing stocks for the coming year?  We're not sure but, technically speaking, the downside targets for these stocks are as follows:
  • QGEN-$17
  • INTC-$12
  • SPLS-$18
  • CELG-$48
  • INFY-$62

If you can handle the downside risk, then these might be opportune purchases.

Watch List Performance Review

The companies on our Watch List from a year ago did not hammer out any kind of investment performance to speak of.  Only two of the six companies did well, Qualcomm (QCOM) which rose 48.86% and Genzyme (GENZ) which got bought by SanofiAventis (SNY) for $74 a share.  As a group, the average gain was only 6.81% while the Nasdaq 100 Index rose 15.67% in the same one year period.

Symbol Name 4/24/2010 4/24/2011
% change
GILD Gilead Sciences 41.67 39.06
-6.26%
QCOM QUALCOMM 38.25 56.94
48.86%
GENZ Genzyme Corp 53.93 74.00
37.21%
ATVI Activision Blizzard 11.60 11.32
-2.41%
RYAAY Ryanair Holdings 29.19 29.43
0.82%
APOL Apollo Group 63.53 39.80
-37.35%
- - - Average
6.81%
^NDX Nasdaq 100 Index 2055.33 2377.3
15.67%

Please revisit New Low Observer for edits and revisions to this post. Email us.

Nasdaq 100 Watch List: April 15, 2011

Below are the Nasdaq 100 companies that are within 21% of the 52-week low. This list is strictly for the purpose of researching whether or not the companies have viable business models. Although theses companies are very risky, they provide significant opportunity to outperform the market in the coming year.
Symbol Name Price P/E EPS Yield P/B % from Low
CSCO Cisco 17.03 12.88 1.32 1.40% 2.08 0.35%
URBN Urban Outfitters 30.64 19.15 1.6 0 3.65 5.55%
TEVA Teva Pharma 50.01 13.65 3.66 1.70% 2.04 6.43%
AMGN Amgen 55.51 11.59 4.79 0 2.13 10.45%
MSFT Microsoft 25.37 10.83 2.34 2.50% 4.41 11.61%
INTC Intel Corp 19.75 9.83 2.01 3.70% 2.18 12.22%
ATVI Activision 11.23 34.03 0.33 1.50% 1.3 12.41%
SPLS Staples 19.98 16.51 1.21 2.00% 2.08 14.50%
MRVL Marvell Tech 15.97 11.92 1.34 0 1.87 15.14%
INFY Infosys 63.21 24.98 2.53 0.70% 7.32 18.64%
CELG Celgene 56.98 30.31 1.88 0 4.43 18.66%
APOL Apollo Group, Inc. 40.1 15.1 2.66 0 4.3 18.81%
AKAM Akamai 38.09 42.13 0.9 0 3.2 18.92%
QGEN Qiagen N.V. 20.37 33.95 0.6 0 1.88 20.82%


Watch List Performance Review

In our review of the Nasdaq 100 Watch List from April 18, 2010, we found that only one company, Genzyme (GENZ), actually outperformed the Nasdaq 100 index.  The remaining 4 companies on the watch list averaged a loss of -0.56%.  When Genzyme (GENZ) is included with the performance of the stocks from last year, the group averaged a gain of 7.98%.

Symbol Name 2010 2011 % Change
GENZ Genzyme 53.64 76.25 42.15%
SYMC Symantec 16.68 18.52 11.03%
RYAAY Ryanair 29.23 29.3 0.24%
ATVI Activision 11.79 11.23 -4.75%
GILD Gilead 45.7 41.7 -8.75%
- - - Average 7.98%
NDX Nasdaq 100 2012.84 2307.58 14.64%

Please revisit New Low Observer for edits and revisions to this post. Email us.

Nasdaq 100 Watch List

Below are the Nasdaq 100 companies that are within 26% of the 52-week low. This list is strictly for the purpose of researching whether or not the companies have viable business models. Although theses companies are very risky, they provide significant opportunity to outperform the market in the coming year.

Symbol Name Trade P/E EPS Yield P/B % from Low
CSCO Cisco Systems $17.04 12.89 $1.32 1.40% 2.08 0.41%
URBN Urban Outfitters $30.35 18.97 $1.60 0 3.48 4.55%
AMGN Amgen Inc. $53.08 11.08 $4.79 0 2.08 5.61%
TEVA Teva Pharma. $50.54 13.79 $3.66 1.80% 2.05 7.55%
ATVI Activision Blizzard $11.01 33.36 $0.33 1.50% 1.27 10.21%
INTC Intel Corporation $19.72 9.81 $2.01 3.60% 2.25 12.05%
MSFT Microsoft Corp. $25.48 10.87 $2.34 2.50% 4.4 12.10%
MRVL Marvell Tech. $15.93 11.89 $1.34 0 1.84 14.85%
SPLS Staples $20.06 16.58 $1.21 2.00% 2.02 14.96%
CELG Celgene Corp. $57.30 30.48 $1.88 0 4.53 19.33%
AKAM Akamai $37.60 41.59 $0.90 0 3.26 19.59%
QGEN Qiagen N.V. $20.31 33.85 $0.60 0 1.89 20.46%
EXPE Expedia, Inc. $22.26 15.25 $1.46 1.30% 2.32 21.64%
APOL Apollo Group $41.41 11.36 $3.65 0 4.17 22.70%
MAT Mattel, Inc. $25.26 13.6 $1.86 3.70% 3.31 25.42%

Nasdaq 100 Summary

On our last  Nasdaq 100 watch list, Cephalon (CEPH) was within 6% of the 52-week low.  This week, Cephalon was presented with an offer that seemed exceptional.  Valeant (VRX) announced that it was willing to offer a buyout of Cephalon at $73.  The market reaction to this was to push Cephalon above the offer price to $75.  At the same time, Valeant's stock price has jumped more than 15% indicating that the market feels that Cephalon could use a shake-up.  Our individual recommendation of Cephalon was issued on February 15, 2011 and can be found here
Also on our watch list from February 20, 2011, Celgene (CELG) has quietly crept 7% higher from where it once was.  According to Value Line dated January 14, 2011, Celegene has no debt, minimal increase of shares outstanding in the last three years, return on equity and return on capital are both in the high teens and book value that has grown over 11x since 2003.
Another company that we're watching closely is Amgen (AMGN).  The price of Amgen has vacillated in a narrowing range since 2008.   At the same time, Amgen has seen its shares outstanding decrease by 27.7% since 2002.  Amgen has very compelling financials which belies the lackluster performance in the stock price.

Nasdaq 100 Performance Review

Symbol Name 3/26/2010 3/26/2011 % change
GILD Gilead Sciences $45.34 $42.08 -7.19%
GENZ Genzyme Corp. $53.00 $75.94 43.28%
APOL Apollo Group $61.28 $43.51 -29.00%
QCOM Qualcomm $41.10 $52.75 28.35%
FSLR First Solar $116.50 $150.44 29.13%
SRCL Stericycle, Inc. $54.50 $88.82 62.97%
- Average - - 21.26%
NDX Nasdaq 100 1952.63 2326.26 19.13%
Our watch list from March 26, 2010 (found here) performed well considering that Apollo Group (APOL) has continued to fall due to closer scrutiny of Apollo's business practices.  Gilead Sciences (GILD) managed to decline -30% before coming full circle with a 1-year loss of "only" -7%.  The average gain for the whole group was 21.26% which was slightly ahead of the Nasdaq 100 index by 2.13%.
Please revisit New Low Observer for edits and revisions to this post. Email us.

Nasdaq 100 Watch List

Below are the Nasdaq 100 companies that are within 20% of the 52-week low. This list is strictly for the purpose of researching whether or not the companies have viable business models. Although these companies are very risky, they provide significant opportunity to outperform the market in the coming year.
Symbol Name Trade P/E EPS Yield P/B % from Low
CSCO Cisco Systems, Inc. $18.40 13.92 $1.32 0.00% 2.25 0.93%
CEPH Cephalon, Inc. $56.17 10.66 $5.27 0.00% 1.66 2.13%
AMGN Amgen Inc. $52.32 10.92 $4.79 0.00% 2.04 4.10%
TEVA Teva Pharma. $50.32 13.73 $3.66 1.70% 2.07 7.09%
ATVI Activision Blizzard $11.27 34.15 $0.33 1.50% 1.30 12.81%
CELG Celgene Corp $54.26 28.86 $1.88 0.00% 4.83 12.99%
EXPE Expedia, Inc. $20.78 14.23 $1.46 1.40% 2.07 13.55%
MSFT Microsoft Corp $25.95 11.08 $2.34 2.40% 4.54 14.18%
MRVL Marvell Tech $16.13 12.28 $1.31 0.00% 2.27 16.29%
SPLS Staples, Inc. $20.43 17.78 $1.15 1.70% 2.25 17.08%
MICC Millicom Intl $89.59 5.88 $15.24 2.70% 3.07 18.96%
Watch List Insights

All things being equal, the number of shares outstanding affects the reported earnings of a company.  Some companies have no debt but they have increased the shares outstanding by a significant amount.  Ultimately, a company from 1994 with the same number of shares outstanding, or fewer, is a better value proposition as long as their debt hasn't increased at the same time. 

Below is the watch list with the percentage change in the shares and the year the data started from.  As you will note, companies like Amgen, Activision and Microsoft have decreased the number of shares outstanding.  Provided their debt position hasn't increased in the same time frame, they may be quality investment opportunities.

Symbol
shares outstanding +/-
Since
21%
1994
82%
2000
-6%
1994
73%
2000
-4%
2008
387%
1994
17%
2004
-7%
1994
38%
2000
53%
1994
n/a
n/a

Watch List Performance Review

In our ongoing review of the Nasdaq 100 Watch List, we have taken the stocks from our list of March 6, 2010 (article here) and have checked their performance one year later. The companies on that list are provided below with the closing price for March 5, 2010 and March 4, 2011. 
Only three of the companies on our list managed to exceed the Nasdaq 100 while the other four on the list underperformed the index.  Stericycle (SRCL) was the biggest winner with a 55.19% gain.  Apollo Group (APOL) was the biggest loser over the last year with a decline of -29.01%.

Symbol Name 3/5/2010 3/4/2011
% change
FSLR First Solar $108.61 $146.57
34.95%
ERTS Electronic Arts $17.12 $18.79
9.75%
GILD Gilead Sciences $47.61 $40.71
-14.49%
APOL Apollo Group $62.39 $44.29
-29.01%
QCOM QUALCOMM $38.76 $58.15
50.03%
ATVI Activision Blizzard $11.03 $11.27
2.18%
SRCL Stericycle $55.35 $85.90
55.19%
Average
15.51%
NDX Nasdaq 100 1,888.56 2,359.96
24.96%

Please revisit New Low Observer for edits and revisions to this post. Email us.

Nasdaq 100 Watch List

Below are the Nasdaq 100 companies that are within 20% of the 52-week low. This list is strictly for the purpose of researching whether or not the companies have viable business models. Although theses companies are very risky, they provide significant opportunity to outperform the market in the coming year.
Symbol Name Price P/E EPS Yield P/B % from Low
CSCO Cisco Systems, Inc. $18.85 14.26 $1.32 0 2.26 1.56%
AMGN Amgen Inc. $52.24 10.91 $4.79 0 2.04 3.94%
CEPH Cephalon, Inc. $58.63 11.13 $5.27 0 1.68 6.60%
TEVA Teva Pharma. $51.89 14.16 $3.66 1.70% 2.13 10.43%
ATVI Activision Blizzard, Inc $11.07 33.55 $0.33 1.50% 1.3 10.81%
CELG Celgene Corp. $53.47 28.44 $1.88 0 4.79 11.35%
EXPE Expedia, Inc. $20.96 14.36 $1.46 1.30% 2.15 14.54%
MSFT Microsoft Corp. $27.06 11.55 $2.34 2.40% 4.72 19.05%
MICC Millicom Intl. Cellular $90.27 5.92 $15.24 2.60% 3.06 19.86%

Watch List Performance Review

In our ongoing review of the Nasdaq 100 Watch List, we have taken the stocks from our list of February 21, 2010 (article here) and have checked their performance one year later. The companies on that list are provided below with the closing price for February 19, 2010 and February 18, 2011. 
Four of the companies on our list managed to exceed the Nasdaq 100 while the other four on the list underperformed the index.  Stericycle (SRCL) was the biggest winner with a 60.92% gain.  Gilead Sciences (GILD) was the biggest loser over the last year with a decline of -19.53%.
Symbol Name 2010 2011 Change
APOL Apollo Group $56.92 $45.82 -19.50%
ERTS Electronic Arts $16.75 $19.28 15.10%
FSLR First Solar $116.00 $168.22 45.02%
ATVI Activision $10.79 $11.07 2.59%
PPDI Pharma Prod. $21.20 $27.97 31.93%
SRCL Stericycle $54.30 $87.38 60.92%
GENZ Genzyme $55.97 $75.38 34.68%
GILD Gilead $48.84 $39.30 -19.53%
Average 18.90%
NDX Nasdaq 100 1823.32 2392.47 31.22%
Please revisit New Low Observer for edits and revisions to this post. Email us.