Category Archives: NLO performance

U.S. Dividend Watch List: December 4, 2015

Top Five Watch List Performance Review

In our ongoing review of the NLO Dividend Watch List, we have taken the top five stocks on our list from December 5, 2014 and have checked the performance one year later. The top five companies on that list can be seen in the table below.

Symbol Name 2013 Price 2014 Price % change
MDU MDU Resources Group 23.78 17.69 -25.6%
HP Helmerich & Payne 67.44 53.38 -20.8%
IBM IBM 163.27 140.43 -14.0%
MUR Murphy Oil Corporation 48.92 25.46 -48.0%
SCL Stepan 41.26 52.05 26.2%
      Average -16.5%
         
DJI Dow Jones Industrial 17,958.79 17,847.63 -0.6%
SPX S&P 500 2,075.37 2,091.69 0.8%

Watch List Review

Our top five companies fell on average 16.5% compared to the market which was up less than 1%. Three of the five companies are tied to the energy market which is in a deep bear market. The largest decline came from Murphy Oil (MUR) which lost nearly half of its market value. The fall in oil price was unpredictable and has taken the resource industry on a wild ride.

On the opposite end, the biggest gain came from Stepan (SCL) which is a chemical company. The gain may have been driven from 13% rise in profit in addition to the multiple expansion in the shares. Last year, Stepan was trading at just 15x trailing earnings. Today, it is trading at 17x profit that is 13% higher.

U.S. Dividend Watch List: December 4, 2015

After the S&P broke 2,100 mid-week, the market took a turn falling below 2,050 but regained most of the loss. At the end of the week, there are 19 companies on our watch list. Continue reading

NLO Dividend Watch List: February 10, 2012

Despite the Euro debt fears, the market continued to churn higher.  The S&P 500 is coming close to testing its April 2011 high of 1363. The momentum in the market has pushed investors to move into the cyclical names. As such, you'll see many great household names on this week watch list. Below are 15 companies that are within 11% of the 52-week low.

February 10, 2012

Symbol Name Price % Yr Low P/E EPS (ttm) Dividend Yield Payout Ratio
CRR Carbo Ceramics 85.94 0.26% 15.29 5.62 0.96 1.12% 17%
CHRW C.H. Robinson Worldwide 63.5 1.93% 24.24 2.62 1.32 2.08% 50%
CCBG Capital City Bank Group 8.85 2.08% 30.52 0.29 0.40 4.52% 138%
TR Tootsie Roll Industries Inc 23.62 3.51% 32.81 0.72 0.32 1.35% 44%
CLX Clorox 67.75 7.44% 16.52 4.1 2.40 3.54% 59%
NFG National Fuel Gas 47.88 7.57% 15.35 3.12 1.42 2.97% 46%
JW-A John Wiley & Sons CL 'A' 45.39 8.36% 15.93 2.85 0.80 1.76% 28%
PEP PepsiCo 63.95 9.32% 16.03 3.99 2.06 3.22% 52%
T AT&T Inc 29.84 9.42% 45.21 0.66 1.76 5.90% 267%
BDX Becton, Dickinson and 76.42 9.81% 13.95 5.48 1.80 2.36% 33%
CWT California Water Service 18.29 9.85% 18.66 0.98 0.63 3.44% 64%
HNZ HJ Heinz 51.87 10.39% 17.52 2.96 1.92 3.70% 65%
ATO Atmos Energy Corp. 31.56 10.70% 13.90 2.27 1.38 4.37% 61%
KO Coca-Cola Co 67.94 10.85% 12.49 5.44 1.88 2.77% 35%
PG Procter & Gamble 63.88 10.98% 18.79 3.4 2.10 3.29% 62%
15 Companies

Watch List Summary

Topping our list this week is Carbo Ceramics (CRR) which is in a free fall. The manufacturer of ceramics used in hydraulic fracturing has been punished because of its ties to shale drilling. We suspect that some relief rally may be coming as CRR are heavily oversold. The historical dividend yield suggests that shares may be undervalued but further assessment should be made. Investors should have time for researching the stock since most dividend stocks typically do not make a "V shape" bottom.

Looking a bit further into the list you'll find many great household name such as Tootsie Roll (TR), Clorox (CLX), Pepsi (PEP), and AT&T (T). Investors craving income can get on average of a 3% yield from the entire list, three of which are Dow Jones Industrial components.

Top Five Performance Review

In our ongoing review of the NLO Dividend Watch List, we have taken the top five stocks on our list from February 11, 2011 and have check their performance one year later. The top five companies on that list can be seen in the table below.

Symbol Name 2011 Price 2012 Price % change
ABT Abbott Laboratories 45.56 55.11 20.96%
SYY Sysco Corp. 28.24 29.31 3.79%
PPL PP&L Corporation 24.75 28.45 14.95%
WABC Westamerica BanCorp. 51 46.63 -8.57%
MCY Mercury General Corp. 40.07 43.45 8.44%
      Average 7.91%
         
DJI Dow Jones Industrial 12,273.26 12,801.23 4.30%
SPX S&P 500 1,329.15 1,342.64 1.01%

Disclaimer
On our current list, we excluded companies that have no earnings. Stocks that appear on our watch lists are not recommendations to buy. Instead, they are the starting point for doing your research and determining the best company to buy. Ideally, a stock that is purchased from this list is done after a considerable decline in the price and extensive due diligence. We suggest that readers use the March 2009 low (or the companies' most distressed level in the last 2 years) as the downside projection for investing. Our view is to embrace the worse case scenario prior to investing. A minimum of 50% decline or the November 2008 to March 2009 low, whichever is lower, would fit that description. It is important to place these companies on your own watch list so that when the opportunity arises, you can purchase them with a greater margin of safety. It is our expectation that, at the most, only 1/3 of the companies that are part of our list will outperform the market over a one-year period
.

2011 Performance Review

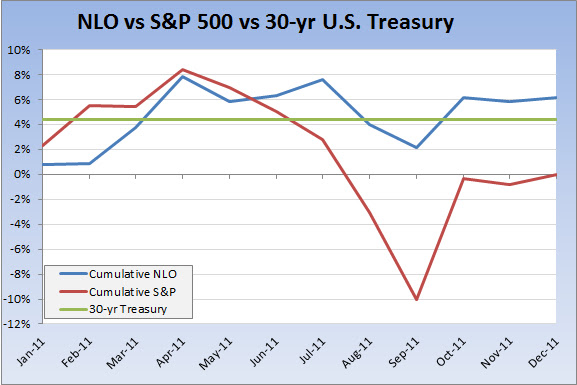
Below is a charting of howour investment portfolio performed against the S&P 500 index and the30-year Treasury based on the January 3, 2011 rate (foundhere).
As with our 2010 performance (foundhere), the 2011 portfolio experienced far less volatility than the S&P500 Index and did not fall into negative territory throughout the year.  Our end of year return was +6.20% compared tothe S&P 500’s no change for 2011.   We continue to lean on holding high levels ofour funds in cash.  Our average cash holdingsthroughout 2011 was 42.41% , based on end of month figures.
Our new target rate for 2012 is set at a mind-numbing low of2.98%, based on the January 3, 2012 30-year Treasury rate (foundhere).  Below is the annualperformance of our portfolio since the end of 2005:

Year Dow S&P 500 Nasdaq NLO Portfolio
2006 16.29% 15.74% 9.52% 18.30%
2007 6.43% 5.46% 9.81% 19.80%
2008 -33.84% -37.22% -40.54% 14.35%
2009 18.82% 27.11% 43.89% 36.65%
2010 11.02% 14.32% 16.91% 7.14%
2011 5.53% 0.00% -1.80% 6.20%

NLO Dividend Watch List: December 30, 2011

The S&P 500 ended the year at precisely where it started. The Dow, however, ended up nearly 6% for the year.

Our list from last year (December 31, 2010) posted an average gain of 9.5% which is considerably better than the overall market. This brings us to the end of the year watch list for 2011. As it stands, there are 22 companies this year versus 10 companies from last year. There is considerably less concentration compared to our list from last year. Below are the 22 companies ending our 2011 watch list:

December 30, 2011

Symbol Name Price % Yr Low P/E EPS (ttm) Dividend Yield Payout Ratio
TR Tootsie Roll Industries Inc  23.67 3.72% 32.88 0.72 0.32 1.35% 44%
FRS Frisch's Restaurants, Inc 19.4 5.21% 22.05 0.88 0.64 3.30% 73%
BMO Bank of Montreal 54.81 5.75% 10.66 5.14 2.74 5.00% 53%
BCR CR Bard, Inc. 85.5 5.82% 21.98 3.89 0.76 0.89% 20%
JW-A John Wiley & Sons Inc. 44.4 5.99% 15.58 2.85 0.80 1.80% 28%
LM Legg Mason, Inc.  24.05 6.37% 14.66 1.64 0.32 1.33% 20%
SCHW Charles Schwab Corp. 11.26 6.63% 16.81 0.67 0.24 2.13% 36%
WST West Pharmaceutical 37.95 6.90% 20.97 1.81 0.72 1.90% 40%
EXPD Expeditors Intl of Washington 40.96 7.08% 22.63 1.81 0.50 1.22% 28%
GS Goldman Sachs Group, Inc.   90.43 7.31% 13.76 6.57 1.40 1.55% 21%
BDX Becton, Dickinson and Co. 74.72 7.37% 13.30 5.62 1.80 2.41% 32%
OMI Owens & Minor, Inc. 27.79 7.42% 15.61 1.78 0.80 2.88% 45%
CAH Cardinal Health, Inc.   40.61 8.21% 15.86 2.56 0.86 2.12% 34%
AVP Avon Products, Inc. 17.47 8.58% 10.28 1.70 0.92 5.27% 54%
WAG Walgreen Co. 33.06 8.97% 11.17 2.96 0.90 2.72% 30%
AROW Arrow Financial Corp.  23.44 9.02% 12.67 1.85 1.00 4.27% 54%
UTX United Technologies Corp. 73.09 9.30% 13.71 5.33 1.92 2.63% 36%
BMI Badger Meter, Inc. 29.43 9.57% 18.28 1.61 0.64 2.17% 40%
CWT California Water Service 18.26 9.67% 18.63 0.98 0.62 3.40% 63%
CLX Clorox Co. 66.56 9.91% 19.18 3.47 2.40 3.61% 69%
MATW Matthews International Corp.  31.43 10.01% 12.78 2.46 0.36 1.15% 15%
BMS Bemis Co Inc 30.08 10.55% 15.12 1.99 0.96 3.19% 48%

We've reviewed many companies last week and nothing materially changed therefore we suggest readers revisit our posting from December 23, 2011 for watch list summary.

Last Year Review

We've suggested the following asset allocation for the 10 stocks. If one was to follow that conservative allocation with 51% in cash, one would end up with a gain of 4.3% excluding dividends.

Disclaimer

On our current list, we excluded companies that have no earnings. Stocks that appear on our watch lists are not recommendations to buy. Instead, they are the starting point for doing your research and determining the best company to buy. Ideally, a stock that is purchased from this list is done after a considerable decline in the price and extensive due diligence. We suggest that readers use the March 2009 low (or the companies' most distressed level in the last 2 years) as the downside projection for investing. Our view is to embrace the worse case scenario prior to investing. A minimum of 50% decline or the November 2008 to March 2009 low, whichever is lower, would fit that description. It is important to place these companies on your own watch list so that when the opportunity arises, you can purchase them with a greater margin of safety. It is our expectation that, at the most, only 1/3 of the companies that are part of our list will outperform the market over a one-year period.

Please consider donating to the New Low Observer. Thank you.

2010 Performance Review

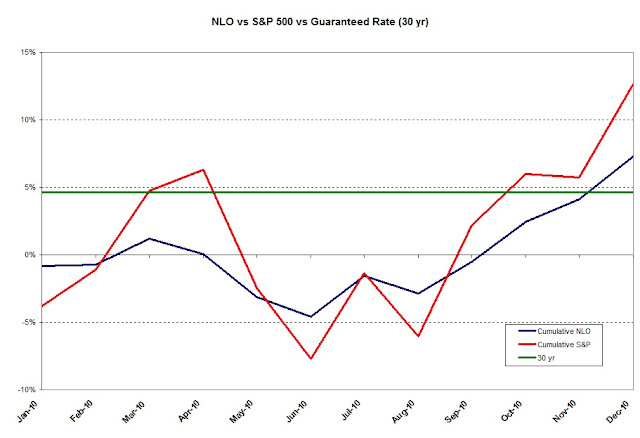
This year was the worst performing year for the New Low Observer in the last five years since our investment approach was codified.  Despite our lackluster performance, you can see that our portfolio incurred less volatility that the S&P 500 index.  We believe this has a lot to do with our philosophy, or the lack thereof, on diversification.  Although our portfolio did not beat any of the major indexes (Dow Industrials, S&P 500, and Nasdaq Composite) we did manage to exceed the return of our primary target, the 30-year U.S. treasury. 
Below is the end of month performance chart of the NLO portfolio and the S&P 500 during 2010.  Throughout the entire year we averaged 50% of the portfolio in stocks and 50% in cash.  The period from January to June reflects partial implementation of our strategy.  The second half of the year, June to December, reflects the full use of our investment strategy.
New Low Observer performance for 2010 (http://www.newlowobserver.com/)
Our new target to beat in the coming year is the 30-year treasury yield as of January 3, 2011 at a rate of 4.39%.  Although this is a modest target, we cannot easily justify the buying and selling of stocks if we cannot exceed the return of a guaranteed rate. 
Below is the performance of our portfolio since the end of 2005:

Dow
S&P
NASDAQ
NLO
2006
16.29%
15.74%
9.52%
18.30%
2007
6.43%
5.46%
9.81%
19.80%
2008
-33.84%
-37.22%
-40.54%
14.35%
2009
18.82%
27.11%
43.89%
36.65%
2010
11.02%
14.32%
16.91%
7.14%