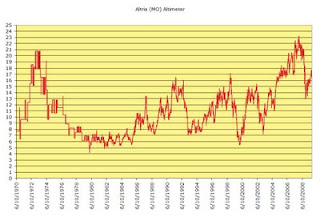
In the first chart we see that MO is considered overvalued when the indicator is at 16 and above and is undervalued when the indicator is at 7 or below.
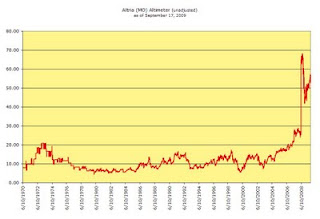
 The chart below is also the altimeter for MO however, it reflects the valuation if unadjusted for the spin-off of Kraft (KFT) and Philip Morris International (PM).
 Hopefully these charts give a better understanding of when might be a good time to invest in MO. As you can tell from the first chart, MO is presently considered overvalued. Touc.
