Category Archives: Richard Russell Review

On This Date: Richard Russell

On this date in 1980, Richard Russell said:

If You Leap, You Will Fall

“Let’s trot out an old but very useful market adage. It is that a trend is taken to continue in force until proved otherwise. We can be suspicious, we can hate the market, we can be out of the market, we can talk the market down to our friends and neighbors, but brother, we better not put out shorts until we have hard evidence that the bull trend is over and the bear is firmly in command-that is if we want to stay solvent (Russell, Richard. Dow Theory Letters. Letter 777. February 27, 1980. page 1.).”

Another way of saying the above is as follows:

“The wish must never be allowed to father the thought (Rhea, Robert. The Dow Theory. 1932. Barron’s Publishing. page 26.).”

Obviously staying solvent should be the primary goal.  However, you need not invest to “stay solvent.”  For all intents and purposes, even a person who “saves” in the traditional sense loses money by way of inflation and taxes. However, the fact that someone would chose to invest requires accepting that some or all money invested can be lost.

Most investors seem to get into the stock market or a specific stock because they think their investment will do well.  Seldom does an investor buy a stock hoping that it will lose money or languish.  Warren Buffett is among that rare group of (successful) investors who could make that claim.  In his annual report to shareholders, Buffett said the following:

“Our quiz for the day: What should a long-term shareholder, such as Berkshire, cheer for during that period? I won’t keep you in suspense. We should wish for IBM’s stock price to languish throughout the five years (source: 2011 Berkshire Hathaway Annual Report. page 6).”

Maybe Buffett can “afford” to have such a cavalier attitude about a technology stock like IBM after not buying any tech stocks which has cemented him as the world’s premier investor.  However, we believe that having Buffett’s thought process could help in dealing with not allowing the wish to father the thought. Otherwise, the concept of investing and hoping becomes a feedback loop that ends with inaccurate conclusions such as, “I’m never investing in stocks again, it is a scam run by manipulators and thieves.  I’m going to put my money with an advisor and let her deal with the headache when I start ‘losing’ money.”

Continue reading

Market Rewind: S&P 3,384/Dow 3,384

On September 14, 2020, the S&P 500 Index closed at 3,383.54.  To celebrate, we are going to review what Richard Russell’s Dow Theory Letters had to say about the market when the Dow Jones Industrial Average closed at 3,384.32 on August 4, 1992.

Russell said:

"...the nation's in a 'contained depression'."

"Interest rates have collapsed, consumers are gloomy, and nobody's taking out loans.  That's exactly what happened during the Great Depression--with one big difference.  Then the stock markets were crashing but today the markets are bullish. So how are the two periods different? As I interpret it, today's stock market is saying that somewhere ahead business is going to pick up and people will start buying again---unlike during the 1930s."

"for the first time since the Great Depression almost all the nations in the northern hemisphere are in various stages of a recession."

"...the widely publicized figure is that 40% of the 5,000 listed stocks have been downed by 30% or more.  On that basis, some analysts are referring to 1992 as the 'year of the hidden bear market'..."

That was page one of six from the August 5, 1992 issue of Dow Theory Letters. Fascinating? History doesn’t need to repeat.  However, good analysis starts with precedents first, as outlined by Charles H. Dow, and diverges afterward, not the other way around.

What was being said by other analysts is not too different from what we’re hearing today. We all know what has happened to the Dow since August 4, 1992.

image

Richard Russell Review: July 5, 1974

This from Dow Theory Letters on July 5, 1974.

"What’s happening, what’s gone wrong? The answer: there's a giant squeeze in world liquidity, and it is scaring the devil out of investors, large and small, from one end of the globe to the other. Last week two German banks declared bankruptcy, while it was revealed (WSJ, June 26) that an oil-drilling "tax write-off" situation has turned into what may be the biggest swindle in US history. On June 27 trading in Westinghouse was halted at 12 1/8 (“you can be short if it’s Westinghouse”), and an hour later the President of the company announced that the outfit was solvent (all this while WX broke its 1962 low) (page 1)."

Those two German banks were Bankhaus I.D. Herstatt of Cologne and Bass & Herz Bankhaus.  This was a situation where the failure of Herstatt led to the failure of Bass & Herz and a host of other substantial losses. 

Chase Manhattan Bank was in possession of $156 million in Herstatt deposits.  This meant that U.S. creditors (namely Citibank’s British banking unit of Hill, Samuel & Co.) were seeking claims on these funds even though Chase Manhattan had no authority to recognize the claims. 

Seattle First National Bank (SeaFirst) was caught in a bind when they performed a $22.5 million transaction at their Swiss subsidiary and the funds were not transferred to the parent company hours before Herstatt was forced into bankruptcy.

In classic scam fashion, the oil-drilling "tax write-off" scheme was named Home-stake Production Company of Tulsa Oklahoma.  Using the name “Homestake” tied the swindler with the success and stability of Homestake Mining while not having achieved anything of note. 

What made this swindle exceptional is the fact that people like Liza Minelli, Candice Bergen, and Buddy Hackett (as well as Congressmen) were involved in the money losing fraud.  The motivation for getting into these “tax write-off” schemes might have been inspired, at the peak, by articles like the following from Barron’s in March 1974.

image

“Bank shares at 10% yields mean that investor are scared of the banks (page 2).”

It was not long before this comment was published on banks that banks were on a mad dash to lure investors and analysts.  In a Barron’s article titled “Beautiful Balloon?” it was indicated that the 1970  amendment to the Bank Holding Company Act of 1956 led banks “…into related (and some not-so-related) financial areas.

image

It was those related financial areas that banks had “…been heavily engaged in financing real estate activities, and, despite the debacle among REITs, thus far have escaped essentially unscathed.”  It wasn’t long before those banks almost paid the price for their foray into REITs, until the government intervened.  This article from Barron’s should have been titled “Beautiful Bubble” as the collapse was in the early stages at this time and by July 5, 1974, there was more pain until December 1974, to the tune of –27.04% in the Dow Jones Industrial Average.

image

see also: Homestake Mining: The Exception that Proves the Rule

Richard Russell Review: July 3, 1996

This from Dow Theory Letters on July 3, 1996.

"To conquer the beast, you must first learn to love it (page 1)."

When looking for similar quotes online, we found the following:

  • "Keep your friends close and your enemies closer."
  • "Know your enemy and know yourself and you will always be victorious."
  • "If you know the enemy and know yourself, you need not fear the result of a hundred battles. If you know yourself but not the enemy, for every victory gained you will also suffer a defeat. If you know neither the enemy nor yourself, you will succumb in every battle." –Sun Tzu

The last quote from Sun Tzu seems the most fitting and provides the appropriate context.

“The June 27 WSJ headlined an article, ‘Strong Summer Rally, Then a Plunge, Predicted by Four Technical Analysts.’ Maybe, but that sounds too pat to me. A strong summer rally would allow all those sophisticated analysts (and their followers) to exit the market handily. If, and I say IF, a bear market is just around the comer, it’s not going to happen that way (page 2).”

image

The July 29, 1996 low and subsequent rise proved Russell’s suspicions to be correct.

"Steve Briese, the sophisticated editor of the Bullish Review [(612) 423-4900] in his latest report notes that “turns in both Cotton and Copper have accompanied many important stock market tops -- far more than coincidence alone would explain (except to a bull wearing blinders) (page 3).”

image

image

From the charts of cotton and copper below, we can see that copper makes a parabolic move then slowly declines to the low.  It is the low that is most characteristic of a turn higher for the stock market rather than the turn lower which can drag out for a long period of time while the stock market continues to climb.

"The commodity world is still in shock from the incredible losses sustained by Sumitomo, losses stemming from 10 years of trading via their rogue trader, Yasuo Hamanaka. How could 10 years of wacky trading be hidden from authorities? Obviously, some people had suspicions (page 5)."

image

“Conclusion: The bull market appears to be intact. Time after time the market backs off and turns erratic. But each time the PTI bucks the trend and pushes up to a new high. When this pattern in the PTI reverses (and some day it will), the market will be in trouble. Until then. the bull remains in command.”

This conclusion, based on the PTI, was proven to be accurate as noted in the market performance above.  There will be more to discuss based on Russell’s PTI going forward.

Richard Russell Review: Letter 859

On this date in 1983, Richard Russell published Issue 859 of the Dow Theory Letter [526].  At the time, the Dow Jones Industrial Average was at the 1,191.47 level and the Transportation Average was at 531.53.

image

The following Richard Russell Review details the topics of the Elliott Wave and 50% Principles as outlined by A.J. Frost, Robert Prechter and Charles H. Dow.

Continue reading

Richard Russell Review: Letter 1248

On this date in 1998, Richard Russell published Issue 1248 of the Dow Theory Letter.  At the time, the Dow Jones Industrial Average was at the 8,872.79 level and the Transportation Average was at 3,517.52.

image

Russell opens his newsletter by pointing out the distinction between what the market “should be doing” versus what was actually happening.  What was happening?  The market was defying all long-term conventional norms.  In Russell’s word’s, “The conclusion -- always -- is exhaustion.”  Russell felt that the market’s rise was at a mania level and that investing in such a market was clearly a personal choice but that “values will out.”

Continue reading

Richard Russell Review: Letter 449

Bear Market Declines

“Historically, bear markets tend to last 1/3 to ½ as long as the preceding bull markets. Since this bear market is in the process of correcting the 17-year bull market of 1949 to 1966, a rough rule-of-thumb would be that the bear market could last five to eight years (and I will be optimistic in that I hope it lasts nearer to five than eight). However, the interesting part of the picture is that with four years out of the way, the worst the Dow Industrials have done is to decline from their 1966 peak of 995.15 to their 1966 low of 744.32, a total drop of 251 points (Russell, Richard. Dow Theory Letters. January 7, 1970. Letter 449. Page 1.).”

As a “rule-of-thumb”, the 1/3 to ½ (in terms of duration) extent of a bear market decline is pretty good and very consistent. The examples are many and the data is clear. First, let’s take the 1966 peak as the beginning of the bear market. From that time, the ultimate low in the stock market was December 1974. This was eight years from the 1966 peak. True stock market enthusiasts would argue that the bear market for stocks did not end until 1982, when the Dow Jones Industrial Average “permanently” broke above the mythical 1000 level and never looked back. Die hard market historians make a credible claim that the bear market did not end until the inflation-adjusted low achieved in 1978 or 1982.

However, based on the work of Jeremy Siegel (“The Nifty-Fifty Revisited: Do Growth Stocks Ultimately Justify Their Price?” [PDF download]), even if a person had bought the “Go-Go” or “Nifty Fifty” stocks at the 1966 or 1971 peak, investors would have achieved exceptional gains in spite of the high inflation rates until 1982 (by the end of 1995, in support of the “buy-and-hold” strategy).

image

The amount of time that passed from the 2007 peak to the 2009 low was 18 months. This was 38% of the bull market that preceded it from 2003 to 2007. The decline was severe and few would be in the position to stomach the extent of the decline, however, the rebound was inevitable and equally as vicious.

Our default view generally gravitates towards the stock market crash of 1929 to 1932. Even our cautiously optimistic analysis should be thwarted by one of the worst bear markets in history. However, taking note of the fact that the bull market “officially” began in 1921 and unofficially in 1907 or 1915, it is clear that the rule-of-thumb holds up.

Market enthusiasts will often retort that the bear market ends when the market recovers beyond the previous peak as the majority of investors buy near the last market peak. This is a valid point and yet, investing is made better by understanding that the majority is usually wrong and therefore should fight the urge to commit 100% of their investment capital as the market climbs higher and ensure that saved funds are 100% invested as the market falls. There are many benchmarks for determining how low is low enough before 100% of funds are committed so being close enough is better than succumbing to the fear of a falling market.

Continue reading

Richard Russell: The Passing of an Icon

image

Read the full tribute here

Consequences of Falling Oil Prices

Economic events never occur in a vacuum.  Usually there is a string of events that leads from one event to another. One big event can lead to an even bigger event that overshadows the prior calamities that triggered “The Big” event.  The February 9, 1983 issue of Richard Russell’s Dow Theory Letters covers  one market event that led to two major crises that happened at different periods in time.  The two events are joined at the hip based on the decline of oil prices.  This led two separate major bailouts that resulted in the structural shift in the way our brand of capitalism works.

The first event resulted in the Savings and Loan Crisis (S&L Crisis) and is thought to have begun in 1986 due to the Tax Reform Act of 1986 culminating in the bailout of many banks and the eventual bankruptcy of the Federal Savings and Loan Insurance Corporation (FSLIC).

The second event resulted in the Mexican Peso Crisis with the outcome that major banking institutions like Citibank and Goldman Sachs needed to be bailed out.  It is important to note that the Peso Crisis is considered to be as a result of the peso devaluation in 1994.

The true roots of both the S&L Crisis and the Peso Crisis is the decline of oil prices after the inflationary peak in 1980-1981.  Richard Russell’s Dow Theory Letter Issue 854 highlights the seeds of destruction that were going to be much larger than even Russell could have imagined. However, if anyone wishes to understand how the snowball got rolling then this issue highlights the beginning.

The very first quote is an amazing insight of the American dependence of the high price of oil, Richard Russell says the following:

“We’re facing a situation (ironically) where the US is all for holding oil prices at a high level. The banks have lent huge sums of money both to private corporations and to oil producing nations-loans based on rising oil prices. If the oil price cracks badly,  the banks are going to have major problems. On top of that, the US depends on oil taxes (so called “excess profits” tax) for huge chunks of tax income. If oil prices crack then the profits for the oil companies will dive (which they are already doing) and the tax short-fall will be horrendous. (page 1)”

This commentary is staggering in the fact that it was so prescient.  The cracks in the armor of the American oil industry began in Texas when the easy money stopped raining down on oil dependent cities like Houston and Dallas.  In a 1988 issue of Dow Theory Letters, Russell had the following to say:

“With oil prices caving in, Texas now has more people leaving the state than coming in.( Dow Theory Letters. March 9, 1988. page 6.)”

The decline in oil prices led to a decline of jobs for that industry which resulted in a decline in real estate prices as people left the state of Texas.  Loans made by savings and loan institutions in the southwest U.S., to businesses and real estate investors, all went bad at the same time leading to the Savings and Loan Crisis (S&L Crisis).  The S&L Crisis cost several hundreds of billions of dollars and still exist as an off-budget item as part of our national debt.

The decline in the price of oil also crushed foreign economies dependent on the commodity.  The Mexican Peso Crisis, although officially listed as beginning in 1994, had its roots in the early 1980’s.  The natural outcome of this crisis was the bailout of large banking institutions like Citibank and Goldman Sachs when the government stepped in and bought the bad debt held by the bank’s all in gamble.

Likewise, the current boom in commodity rich countries (although somewhat cooler at present) like Australia, Brazil, Russia, China and India could experience significant shocks to their system depending on the level of loans made as “investments” by foreign banking institutions based on the potential of future growth.

Few understood or believed the impact and importance of high oil prices to the American economy at the time.  Even fewer understood the direct reliance of the U.S. government to high oil prices.  Investors should watch for the potential fallout that may arise from the recent precipitous decline in the price of oil.  The troubles afflicting Russia and Brazil’s Petrobras may be early indications of where the pain may be felt.

Review: Bank of Montreal

Contributor C. Cheng Asks:

“What are your concerns regarding the housing bubble forming in Canada and it’s potentially adverse effects on BMO?”

Our Response:

The timeliness of this comment regarding Bank of Montreal (BMO) is critical.  On June 7, 2012 (found here), we posted an Investment Observation on Bank of Montreal which was one of our leading considerations as an investment opportunity.  Keep in mind that our interest in BMO came after a 14-month declining trend in the stock’s price.

At that time we said the following of BMO:

“We are reticent to recommend any kind of banking institution due to the many unexpected risks that occur outside of the purview of regulators and accountants.  However, Bank of Montreal is a reasonable banking investment if bought at the right price.  We believe that the right price begins at $51.80 and below.”

Unfortunately, BMO never fell below $51.80.  In fact, the day that were did our write up on BMO it only fell below the $53.57 price on the five subsequent trading days immediately afterwards, with the lowest price being $52.15 on June 11, 2012.

At the moment, BMO’s stock price has retested the previous high set in November 2013.

image

If there is a concern that Canadian real estate is in a bubble then it would be wise to sell only the principal in BMO while leaving the profits to compound.  This would eliminate the guesswork associated with determining if there is a bubble.  The remaining funds would be allowed to compound at a 5.50% rate until BMO has sustain a similar decline in price from April 2011 to June 2012.

Continue reading

Gold Stocks: Are We There Yet?

Below is a chart and commentary from Richard Russell’s Dow Theory Letters dated July 30, 1976.  It is key that those who are interested in precious metal stocks understand the significance of gold stocks to decline precipitously in spite of being in a gold bull market.  This piece punctuates that idea with some possible insight on how to recognize the bottom of a bear market. Continue reading

Richard Russell Review: Letter 854

Richard Russell’s Dow Theory Letter Issue 854 was published on February 9, 1983.  At the time, the Dow Jones Industrial Average was at the 1,067.42 level.

image

Economic events never occur in a vacuum.  Usually there is a string of events that leads from one event to another. One big event can lead to an even bigger event that overshadows the prior calamities that triggered the “big” event.  This issue of Richard Russell’s Dow Theory Letters covers  one market event that led to major crises that happened at different periods in time.  The two events are joined at the hip based on the decline of oil prices.  This led two separate major bailouts that resulted in structural shift in the way our brand of capitalism works.

Also, this Russell review will cover the topic of cycles in corporate cash and corporate indebtedness. We'll discuss, in brief, where we might be in this cycle.

The first event resulted in the Savings and Loan Crisis and is thought to have begun in 1986 due to the Tax Reform Act of 1986 culminating in the bailout of many banks and the eventual bankruptcy of the Federal Savings and Loan Insurance Corporation (FSLIC).

The second event resulted in the Mexican Peso Crisis with the outcome that major banking institutions like Citibank and Goldman Sachs needed to be bailed out.  It is important to note that the Peso Crisis is considered to be as a result of the peso devaluation in 1994.

The true roots of both the S&L Crisis and the Peso Crisis is the decline of oil prices after the inflationary peak in 1980-1981.  Richard Russell’s Dow Theory Letter Issue 854 highlights the seeds of destruction that were going to be much larger than even Russell could have imagined. However, if anyone wishes to understand how the snowball got rolling then this issue highlights the beginning.

The very first quote is an amazing insight of the American dependence of the high price of oil, Richard Russell says the following:

“We’re facing a situation (ironically) where the US is all for holding oil prices at a high level. The banks have lent huge sums of money both to private corporations and to oil producing nations-loans based on rising oil prices. If the oil price cracks badly,  the banks are going to have major problems. On top of that, the US depends on oil taxes (so called “excess profits” tax) for huge chunks of tax income. If oil prices crack then the profits for the oil companies will dive (which they are already doing) and the tax short-fall will be horrendous. (page 1)”

This commentary is staggering in the fact that it was so prescient.  The cracks in the armor of the American oil industry began in Texas when the easy money stopped raining down on oil dependent cities like Houston and Dallas.  In a 1988 issue of Dow Theory Letters, Russell had the following to say:

“With oil prices caving in, Texas now has more people leaving the state than coming in.( Dow Theory Letters. March 9, 1988. page 6.)”

The decline in oil prices led to a decline of jobs for that industry which resulted in a decline in real estate prices as people left the state of Texas.  Loans made by savings and loan institutions in the southwest U.S., to businesses and real estate investors, all went bad at the same time leading to the Savings and Loan Crisis (S&L Crisis).  The S&L Crisis cost several hundreds of billions of dollars and still exist as an off-budget item as part of our national debt.

The decline in the price of oil also crushed foreign economies dependent on the commodity.  The Mexican Peso Crisis, although officially listed as beginning in 1994, had its roots in the early 1980’s.  The natural outcome of this crisis was the bailout of large banking institutions like Citibank and Goldman Sachs when the government stepped in and bought the bad debt held by the bank’s all in gamble.

Likewise, the current boom in commodity rich countries (although somewhat cooler at present) like Australia, Brazil, Russia, China and India could experience significant shocks to their system depending on the level of loans made as “investments” by foreign banking institutions based on the potential of future growth.

Few understood or believed the impact and importance of high oil prices to the American economy at the time.  Even fewer understood the direct reliance of the U.S. government to high oil prices.  Then as now, the elevated level of the price of gold is being wagered on by the U.S. government in a similar way that it was done when we had high prices in oil.  The excessive printing of money through quantitative easing and other accommodative policies by the Federal Reserve is based on the elevated level in gold prices.

If the price of gold were to collapse then all bets are off.  Unfortunately, many believe that a collapse in gold couldn’t happen while the government is bent on printing money out of thin air.  However, the problem is that commodities like gold are prone to dramatic declines, especially when all bets are that it can’t or won’t happen.

Many die-hard gold investors/speculators are not making the connection between the government’s reliance and expectation of higher prices in gold.  Worse still, gold investors mistakenly believe that the U.S. government wants to see a lower price in gold and that the only direction is up due to accommodative policies.  This is far from the reality, as found out the hard way by the likes of billionaire money manager John Paulson.  Waiting in the wings are other big-time money managers who will likely get bailed out of their money losing bets on gold’s elevated levels.  Those that have leveraged their bets on gold and other commodities will be bailed out using taxpayers money and hidden as an off-budget items as part of the national debt.  Suffice to say, despite all the carnage in the period from 1980 to 2007, the stock market managed to climb over 12 times.

Next up is a comment on how U.S. corporations were strapped with debt. Russell says the following:

“In the shorter term, the argument for holding stocks is that a low rate of inflation will be bullish for stocks. But that argument was never used in a situation like the current one - a situation in which corporations are loaded with debt.  Whether these corporations can survive with debt ridden structure during a period of deflation remains to be seen. (page 3)”

This commentary is interesting because it was at the early stages of a secular bull market when the Dow Jones Industrial Average went from 1,000 to the peak of 14,164, an increase of over 12 times in 24 years (and this was just the “average”).  Now, we seem to be in the early stages of a secular bear market with just the opposite scenario.  Today, we’re being told of the immense cash hoard that corporations happen to be sitting on (WSJ article here).  Furthermore, interest rates are at or near zero and likely to rise as opposed to rates falling from double digit heights in 1980.

We’re not impressed with the claims of corporate strength based on off-shore cash hoards. We believe that what we’re witness to is the corporate equivalent of high tide which is inevitably going to be followed by low tide.  It is only a matter of time that it will be revealed that the idle cash of today will be the debt-laden corporation of tomorrow.  Those that are clamoring (in some cases suing) for companies to disgorge their coffers of excess cash in the form of “special” dividends will not think twice, twenty years from now, that they had unwittingly contributed to the decline of the company that they’ve targeted.

Richard Russell Review: Letter 554

Dow Theory Letters Issue 554 was written on February 7, 1973. At the time, the Dow Jones Industrial Average was indicated to be at the 968.32 level.  This was at a point prior to the Dow Industrials declining –40% while the Dow Transports declined –37% to the late 1974 lows.

Continue reading

Richard Russell’s Latest Miscue

The New Low team has been huge fans of Richard Russell for years. We've learn much about Russell's thinking process as well as his stock market strategy in his work from 1958 to the present. However, his most recent contribution appears to be counter to the whole point of Dow Theory. The following excerpt appears on Financial Sense as well as Dow Theory Letters.

What's the best performing stock of the last few years? Would you believe it -- it's a leading seller of bolts, screws and nuts. (Their products are known as threaded fasteners in the trade.) The name of the hot company is Fastenal.

The stock has been trading for 25 years. The stock has as gone from 13 cents on October 19, 1987 to a recent $50.85. Over the past year Fastenal has gained 60%.

The company stocks thousands of varieties of bolts, nuts, screws and cotter pins in 2,600 stores and serves retail and wholesale customers. For many companies, Fastenal's products are absolutely essential. Whole factories can shut down for lack of one of Fastenal's specially threaded bolts. Fastenal has no serious competition. It would be too difficult to compete with Fastenal's thousands of products for spot delivery. In other words, while Fastenal's products are mundane, many companies can't live without them. If maybe five of a certain bolt is needed, price is absolutely no object. The particular bolt may cost a dollar a piece, but if Fastenal can supply the bolt immediately, the price doesn't mean a thing.

Fastenal had 45 stores in 1987, which was the year its owner decided to take Fastenal public. The company offered 100,000 of the million shares to its employees. Up to date, the price of Fastenal has risen 38,565% and today the company has a market value of $15 billion. It has stores in all 50 states and has also moved into Mexico, Canada, Asia and Europe.

Lesson -- Deal in products that everyone needs. Supply those products in varieties that are beyond the capabilities of any other purveyor. Then offer your products for immediate delivery.

Followers of Dow Theory should know that investment values is the cornerstone of the theory.  This means that even if you don't know anything stock market technicals, buying stocks that are undervalued should be the primary focus.

Unfortunately, it seems that Mr. Russell will revert to the values of Dow Theory when it fits his "mood."  Russell suggests that the market is overvalued based on the dividend yield on the Dow Jones Industrial Average being below 3%.  Why then would he write about Fastenal (FAST) which is at an all-time high and trading at P/E of 43 with a book value of 4.94x?  Additionally, Value Line Investment Survey has estimated that FAST has a fair value at 22x cash flow. Given their 2012 estimate of $1.65 of cash flow per share, we can conservatively say this company is worth $36.

For the sake of reference, we've highlighted Fastenal (FAST) in an April 24, 2010 article titled "Low Yielding Stocks Offer Exceptional Gains".  At the heart of our article was to demonstrate that many stocks with low dividend yields can perform equally as well, if not better, than stocks with high dividend yields given the right conditions (i.e. payout ratio, historical yield range).

Sure this stock could turn out to be the next "Apple" but as an influential Dow Theorist, Russell shouldn't be preaching the merits of a company that is as over-valued as FAST.

Also, we'd like to critique Richard Russell's "lesson." The lesson rings hollow since it suggests investment in "wide moat" companies but doesn't offer up any reasonable alternatives.  This implies that investors acquire shares of FAST at the current price solely based on their "moat" while overlooking the fact that the company is not undervalued.  This is quite alarming since there is a broad range of companies which appears on our latest watch list.

Reference Sources:
What’s the Best Performing Stock of the Last Few Years?
Fastenal Key Statistic as of 3/20/2012
Low Yielding Stocks Offer Exceptional Gains
Dividend Watch List: March 16, 2012

A Strategy is Needed for Lagging Gold Stocks

For gold stock investors, a timing strategy is the most effective way to match or beat the coming metal price increase. Among our caveats, we’re excluding junior and exploration mining companies which will either go out of business, experience share price booms or get acquired by peers or the majors. What follows is our examination of whether the lagging gold stocks, the inability of gold stocks to perform equal to or greater than the price of physical metal, is unique to our time or a fundamental hallmark of gold bull markets.

There is considerable discussion about the divergence between the price of gold and gold stocks. In the divergence, the price of gold has tended to rise to new highs while gold stocks (majors) either trade in a range, decline or increase at a tepid rate compared to the physical metal.

Some argue that due to the divergence, gold stocks represent the best investment opportunity because inevitably, the stocks will catch up with the metal. Others say that, the lack of confirmation of gold stocks to exceed prior highs is an indication that the metal is overvalued or needs to decline.

Unfortunately, although both points seem well reasoned (along with many other explanations), evidence from the previous gold bull market suggests that gold mining majors typically underperform the metal. The primary source that we’re drawing from is Richard Russell’s Dow Theory Letters from 1970 to 1979 with data points confirmed in Barron’s and Kitco.com for the respective dates.

On numerous occasions, Richard Russell would express his concern for the divergence between the price of gold and gold stocks. Below are Russell’s observations of the failure of gold stocks to follow the price of gold higher:

Meanwhile, despite the recent highs in the price of gold bullion, the gold stocks are not keeping up with the price of the yellow metal. I have received many calls from subscribers asking why.” (Richard Russell, Dow Theory Letters, May 17, 1972, Letter 529, page 6.)

The general feeling seems to be that the gold stocks have been discounting [falling in advance of] a decline in bullion.” (Richard Russell, Dow Theory Letters, September 27, 1974, Letter 610, page 6.)

“‘What’s happening to the shares’ I am asked. ‘Why don’t they move with gold?’” (Richard Russell, Dow Theory Letters, January 2, 1975, Letter 618, page 5.

At the bottom of the chart is the Barron’s Gold Average (stocks). This may move, too, but this Average has a long way to go to hit its 1974 high while gold could better the old 200 high easily. That should tell us something. And it’s the reason I’ve been saying all along-gold, not gold stocks.” (Richard Russell, Dow Theory Letters, November 9, 1977, Letter 713, page 5.)

Since Barron’s Average is very heavily weighted in favor of ASA, we are looking to a large extent at the relative performance of the S. African gold shares against bullion. The picture is clear enough. The market, since mid-1974. has preferred bullion to the gold shares. And who am I to argue with the market? That’s the reason I’ve been recommending gold, not the shares.” (Richard Russell, Dow Theory Letters, February 17, 1978, Letter 722, page 6.)

Since late-January the gold stocks have been reactionary whereas gold has been hitting new 1977-78 highs. In March both stocks and the metal declined, and as you can see the stocks broke below their February lows. Yet the metal has not confirmed on the downside, holding well above its February low. I take this non-confirmation as a bullish indication. I think it is telling us that the metal will not respond to gold share weakness, and it is telling us that the metal ‘wants’ to go to new highs. Whether the stocks will follow is another story.” (Richard Russell, Dow Theory Letters, April 5, 1978, Letter 726, page 6.)

My chart of gold and the gold averages (see page 6) is now showing a dramatic divergence. The gold stock average has broke” below its November low, but the bullion price has held well above that point.” (Richard Russell, Dow Theory Letters, May 5, 1978, Letter 729, page 5.)

This non-confirmation between gold and the gold stock average which I discussed in the last Letter is still in force. Many feared that the reactionary tendencies [decline] in the gold shares were calling for a correction in gold. For this reason many advisors have been telling their clients to sell their gold or even short gold. The consequences have been unhappy for the sellers, disastrous for the shorts.” (Richard Russell, Dow Theory Letters, November 1, 1978, Letter 742, page 5.)

My chart of gold bullion (daily) and the Gold Stock Average (GSA) documents the extraordinary divergence which continues to build between gold and GSA. Why did gold and GSA rally in tandem up to the October highs and why are the gold shares so

reluctant now?” (Richard Russell, Dow Theory Letters, February 28, 1979, Letter 751, page 7.

My chart of daily gold and the gold stock average (GSA) continues to picture divergence, with Campbell Red Lake and ASA stubbornly refusing to move back to their October highs.” (Richard Russell, Dow Theory Letters, July 5, 1979, Letter 760, page 6.)

I obviously cannot tell at this time whether gold is going to surge above 307 to a new high- or whether gold is in the process of topping out. The gold stocks have been weak, and my gold stock average has broken below the three minor bottoms. But so far, even weakness in the gold shares has not rubbed off on the metal.” (Richard Russell, Dow Theory Letters, August 15, 1979, Letter 763, page 6.)

To add to the consternation of gold stock investors, the period after the peak in the price of gold in January 1980 showed gold stocks held up better than the metal. This threw off “seasoned” gold investors because it gave the false impression that gold’s collapse would recover somehow. The following is Russell’s comments on this matter after the peak:

The gold stocks did not act during the 1980 decline the way they did during the 1974 debacle. This time they tended to hold very well. Now they are looking bullish (despite the many troubles, the increasing troubles in So. Africa). The shares, in other words, show good relative strength against the metal. This is a good sign for gold in general.” (Richard Russell, Dow Theory Letters, June 4, 1980, Letter 784, page 5.)

Although gold stocks are a leveraged play on the price of gold, there are critical points in time when gold stocks should be bought and then sold in order to take advantage of the leveraged characteristics. Those who buy and hold gold stocks for the “long term” will be disappointed with the performance as compared to the price of gold. Therefore, it is necessary to have a timing indicator that will highlight the best times to invest in gold stocks.

Below we have constructed a gold stock indicator based on the Philadelphia Gold and Silver Stock Index (XAU) which reveals the best times to accumulate and dispose of gold stocks. The points above the red line indicates the time to sell gold stocks and the points below the green line indicate when to buy gold stocks. We’ve taken the liberty of considering a sell indication whenever the indicator first reaches the red zone on a move to the upside and a buy/accumulate when the indicator first falls to the green line on a move to the downside.
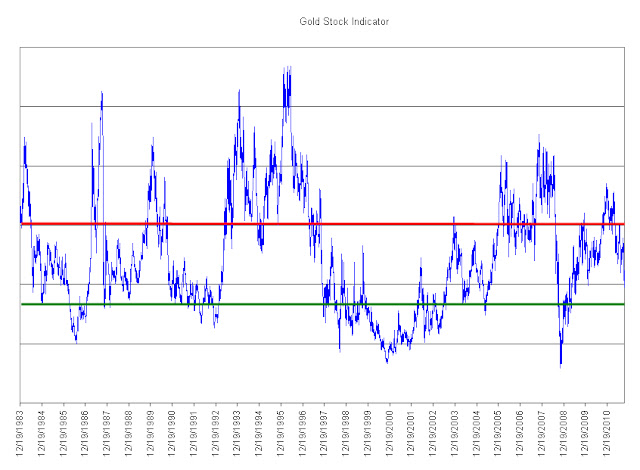
On average, sell indications occurred after a +52% increase in the XAU index. This does not account for the individual performance of gold stocks that are constituents of the index. The consistency of our Gold Stock Indicator reflected the best times to acquire the major gold stocks as well as the most ideal times to sell the gold stocks.
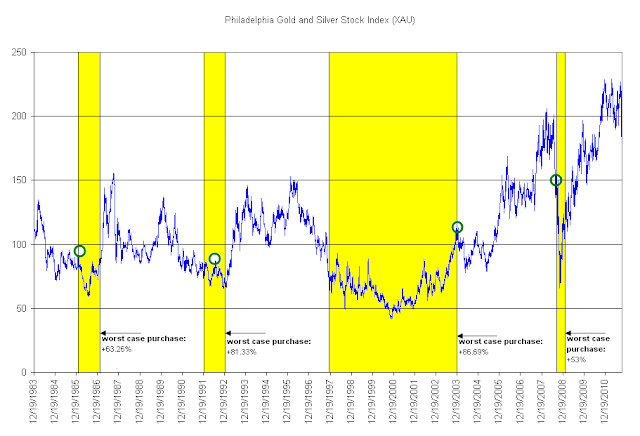
On the chart of the Philadelphia Gold and Silver Stock Index (XAU) above, we have shown where the indicated “buy/accumulate” recommendations would have taken place in yellow. The green circles show what would have happened if the purchase occurred at the worst possible time in the given period and is measured to the respective peaks in the XAU index soon after. As mentioned in many prior articles, we always account for at least -50% downside risk with any investment position that we take. This appears to be a minimum requirement when applying our indicator to the purchase of constituents of the Philadelphia Gold and Silver Stock Index (XAU).

For an investor who wishes to accumulate gold shares from within the XAU index, they would benefit from well timed purchases rather than getting whip-sawed by a wildly gyrating index that will inevitably underperform the price of gold in the “long-term.” We have identified the top five stocks that are likely to outperform the XAU index when the next buy signal is given. The five companies are AngloGold (AU), Yamana Gold (AUY), Gold Fields (GFI), Randgold (GOLD) and Royal Gold (RGLD).

The obvious alternative to buying gold stocks is with the physical asset. The paper version of gold is the SPDR Gold Shares (GLD). Although not truly tested through a full gold bull and bear cycle, GLD remains the among the most popular ways to “invest” in the physical asset. Our preference is for the non-paperized version of gold in the form of one-ounce coins.

As has been demonstrated in the gold bull market from 1970 to 1980, gold stocks (the majors) will generally underperform the price of gold. Those who are bound and determined to buy gold stocks can pursue the juniors and explorers which provide a wide range of outcomes that are independent of the price of gold (but helped by the rising value of gold) based on new discoveries, getting acquired or going bust. The alternative, buying the majors, should be done with a well constructed strategy that does not rely on hold-and-hope.