Category Archives: Richard Russell

Richard Russell Review: Letter 742

Dow Theory Letters issue 742 was published on November 1, 1978. At the time, the Dow Jones Industrial Average indicated was at the 806.05 level. In this issue, Richard Russell discusses several topics that are very important to every Dow Theorist.
First, Russell states that:
…history shows that when bull (or bear) markets really begin, Dow Theory signals are generally greeted with derision, skepticism, and scorn-rather than wholesale agreement!” page 1
This comment is in response to the Dow Theory bull market signal that was given on August 2, 1978. In this case, Russell felt there wasn’t enough skepticism by market participants to warrant a need to trust the signal. I’m guessing that after 12 years of a secular bear market any good news about the market would appeal to the glass half-full crowd.
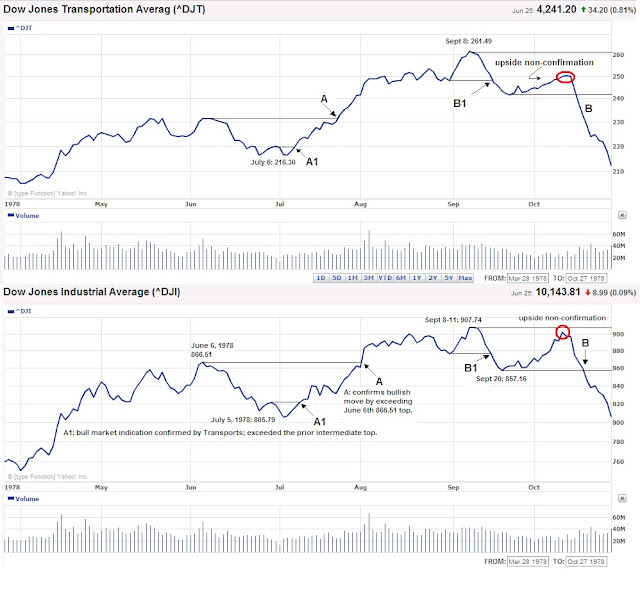
Letter 742 also has a chart (located here) of the Dow Jones Industrials, Transports, Utility Averages and NYSE volume. Upon closer inspection of the chart below, ranging from March 28, 1978 to October 27, 1978, you can find two confirmations of a bull market and one confirmed bear market indication as part of Dow Theory.

According to Russell, point A (August 2nd), on the Dow Industrials, was a false secondary peak or bull market indication. However, it should be noted that when the Industrials went above the June 29th peak of 821.64 (point A1) on July 21st it was a clear indication that the index was going to retest the previous high at point A.

After the bull market move upward a bear market indication was given when the Industrials and Transports fell below point B1 that corresponded to the August 31st low of 876.82 and 248.78 respectively. A bull market non-confirmation was indicated (red circles) in the fact that neither index could exceed the high of September 8, 1978.
Let’s do the math for a moment, point A1 gave a buy signal plus point A’s confirmation of the buy signal equaled a 9.62% rise by the time the market gave the bull market non-confirmation at Dow Industrials 900. The same timing applied to the Dow Transports would have equaled a gain of 13.64%. To my mind, this was in line with our view that any return close to 10% in less than a year is an acceptable amount to trigger a sell of any stock.
Russell also repeats a common attribute that he seeks in the market before considering going “all in.” Russell says:

I noted that every bull market in history had started from an over-sold base, but that this market had not seen a over-sold condition since late-1976.” Page 1.

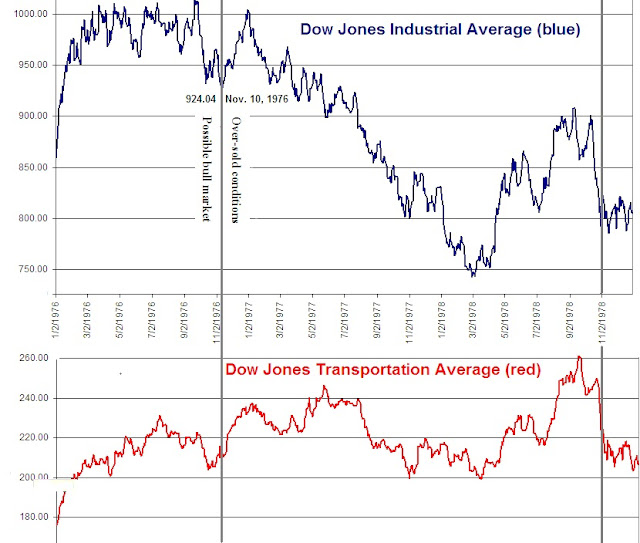
In this remark, I have two thoughts that immediately come to mind which is reflected in the chart below. The first is that even after the 1974 bottom there was another time (1976) that was “most ideal” to buy stocks at over-sold levels, according to Russell. However, even though late-1976 was experiencing oversold conditions, it certainly didn’t mean that further declines were out of the question. After the ’76 bottom, the Dow Industrials had a short rally and then fell as low as 742.12, a decline of 19.69% from the 1976 lows, by February 28, 1978. Finally, the view that an over-sold base is a condition necessary for a bull market may not be accurate.

On page 2 Russell said:

Right now, I want all my subscribers to stay out as per my instructions in Letter after Letter.”

This suggests that after the January 1975 buy signal given by Russell, it was very difficult to keep a long-term position even though it was the absolute best time to “buy and hold” stocks.

The violence and rapidity of this smash has few precedents in stock market history.” Page 2.

When calculated to the November 14, 1978 low, the decline from September 8, 1978 equaled a drop of 13.5%. To me this doesn’t seem like all the much of a decline.

Somewhere in the period ahead, we are going to see the real ‘third phase bear market action’ in the Dow and most other stocks. True, during 1973-1974 the majority of stocks were pulverized in a slide that was comparable to 1929-32 in many ways. But the Dow lost less than 50% of its value at that time. My guess is that before the third or final phase of this bear market is over, we are going to see the Dow at drastic new lows, we’re going to see dividends cut across the board, we’re going to see very high interest rates, and we’re going to see something that this generation has never seen before-wholesale liquidation of debt in all sections of the economy, private, corporate and perhaps even government.” Page 2

“Each time it looks as if the ‘plug is going to be pulled,’ the bear market (with the help of huge infusions of monetary inflation from the Fed) pulls itself out of the hole.” Page 2

Russell was waiting for the third phase of the bear market. According to Russell, the Fed was holding the market up with the trade-off being higher inflation. My thinking is that a crash didn’t occur simply because the Fed was willing to accept higher inflation as a substitute for a crash. In addition, if the markets were to get a crash and record inflation at the same time it would be exceptional situation. The third phase decline that Russell expected never seemed to materialize on the scale of 1973-74 or greater.
Other Notes in Letter 742:
  • E. George Schaefer’s investment performance from 1949 to 1966.
  • James Dines book the “Invisible Crash
  • MC Horsey’s chart of an inflation adjusted Dow since 1960
  • Benjamin and Herbert Stein’s book “On the Brink” with reference to, of all things, the Chinese cornering the gold market
More:

Richard Russell Review: Letter 745

Dow Theory Letters Issue 745 was written on December 6, 1978.  At the time, the Dow Jones Industrial Average was indicated to be at the 811.42 level.  What stood out the most to me was the fact that Richard Russell made very clear commentary on the price of gold and the direction of stocks.  Russell made the following commentary:

"It [gold/stock ratio] is telling us that for the foreseeable future (until the next signal), if we do anything we should do it in stocks." page 3.

Anyone familiar with the stock market in 1978 would know that if you had bought a handful of stocks and didn't sell them until 10 years later you would have had a compounded annual growth rate of 8.73% (this takes into consideration the crash of 1987).  Russell's comments on being in stocks would have seemed to be very much on target.  However, it is his aversion to gold at this time that seems to contradict his earlier comments on gold.
In Letter 742 dated November 1, 1978, Richard Russell said the following about gold:
"Slowly, very slowly, it's dawning on the world that we're witnessing one hell of a bull market-in gold. I've been writing pages and pages about gold in each Letter, trying to get new subscribers in the metal (or the coins), trying to get older subscribers to STAY in gold.  Happily, a large percentage of my subscribers are now sitting with large gold positions.  And the paper profits (in terms of dollars) are mounting." page 5.

This commentary seems odd because in Letter 745, Russell goes on to say:

"At any rate, it is a bearish omen when the [gold] open interest stays high in the face of a persistent decline, and that is what has occurred." page 6

Russell called himself to task by asking the following question:

"Question: Russell, you were so hot on gold a few months ago.  Gold was 'real money,' you said.  Gold 'would save the system,' you said.  How can you just "turn off" on gold?
"Answer: I haven't turned off on gold, I've turned off on gold at this time.  The market isn't like your wife or your daughter who you love through thick and thin.  We're dealing here with correct procedure and purchasing power.  The fact that I advocate gold-backed currency has nothing to do with the fact that I think gold is in a bear trend over the coming months.  In this business, you had better learn that the trend makes you the money, not the item.  I'd rather buy Cesspools, Inc. if that stock was going up than IBM if IBM is heading down." Page 7
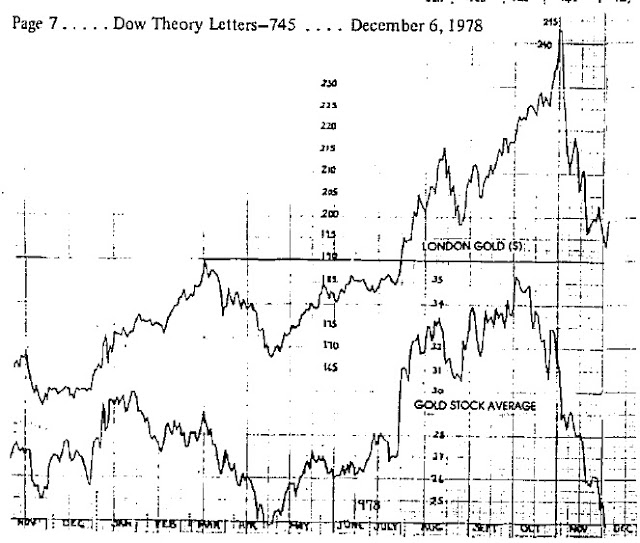
In retrospect, we know that gold went as high as $850 an ounce in January 1980.  However, it is interesting to me that Russell said that a bear trend was approaching "...over the coming months."  In Letter 745, Russell included a chart that compared the London Gold to the Gold Stock Average.


Russell's favorable comments of gold on November 1, 1978 were well off of the highs from the prior month.  However, since Russell was a practioner of Dow Theory and was using the London price of gold along with the equivalent of the XAU gold index to act as a confirming mechanism for the future price of gold, it should have been considered that because the London price didn't fall to the corresponding low set in April of 1978 that there must have been a non-confirmation of the downside trend.  Instead, Russell said the following:
"The GSA [Gold Stock Average] has collapsed, and is now down to its previous low for the year recorded last April.  Bullion has obviously held up better than the gold shares, but so far the downside non-confirmations by bullion have failed to halt the decline.  This kind of action is always indicative of a weak market, and it just seems that there are still too many optimistic gold-holders around." Page 6.
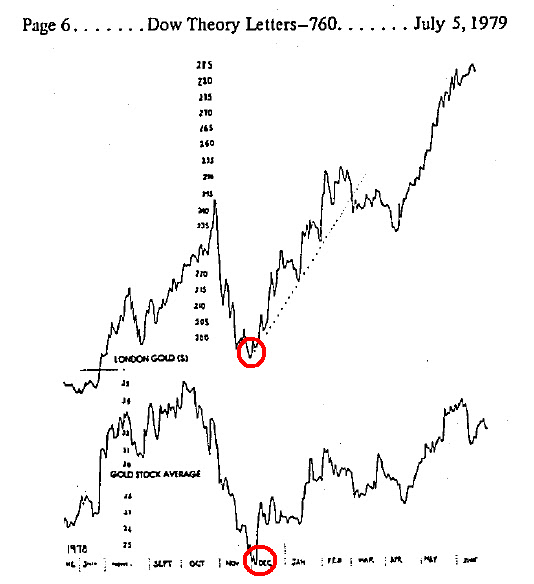
Is it possible that the gold shares are held by the public and speculators (weak hands) and the bullion is held by investors and "institutions" (strong hands)?    Somehow I think this relationship has some value.  I'm just not sure if Russell called this intermediate move correctly.  So I decided to search for an updated version of the London Gold and GSA comparison.  Below is what I found in the July 5, 1979 issue:


It should be noted that the exact bottom in the price of gold and gold stocks (red circles) coincided with the publishing of the December 6, 1978 Letter 745.
Also Worth Mentioning:
  • Russell said that "Greed and options don't mix."  My impression on this remark is that I always thought that the purpose of options is to get exaggerated gains with the trade-off being no equity.  Seems to me that greed and options go hand in hand.
  • Dow Theory Letters are available at http://www.dowtheoryletters.com/
More:

The 4 to 4 1/2 Year Market Cycle

When introducing the topic of market cycles it is often looked upon as something that is more wishful thinking more than anything else. However, it is my hope that I can provided sufficient evidence to convince you that objective observation of the 4 to 4 ½ year market cycle is well worth your time.
Introduction of the topic of the 4 to 4 ½ year market cycle does not come lightly. On September 13, 1900, Charles H. Dow, founder and editor of the Wall Street Journal, referenced the 4-year cycle as noted below:
We have frequently demonstrated that the stock market, while full of short fluctuations, has a continuing main movement, which often runs in one direction for three or four years at a time.”
Again on February 21, 1901, Dow makes reference to the 4 to 4 ½ year cycle by saying:
For the past 25 years the commodity market and the stock market have moved almost exactly together. The index number representing many commodities rose from 88 in 1878 to 120 in 1881. It dropped back to 90 in 1885, rose to 95 in 1891, dropped back to 73 in 1896, and recovered to 90 in 1900. Furthermore, index numbers kept in Europe and applied to quite different commodities had almost exactly the same movement in the same time. It is not necessary to say to anyone familiar with the course of the stock market that this has been exactly the course of stocks in the same period.”
All of the period that Dow mentions are based on the 4 year market cycle.  However, you don’t need to have a background in secular bull or bear markets from the 19th century to understand the value and weight of the 4 to 4 ½ year market cycle. In the Richard Russell’s Dow Theory Letter dated July 5, 1979, the 4 to 4 ½ year cycle is mentioned again. Of the cycle in question, Russell said:
We appear to have skipped the surest thing in the market this year, and that is the bottoming of the 4 to 4 ½ year cycle.”
Russell said this even though in retrospect we can clearly see, from a technical standpoint, that 1978 was the actual bottom in the cycle. Only four years later was the ultimate bottom of 1982 that would be the launching pad for the bull market from Dow 1,000 to Dow 10,000. In the same 1979 issue of the Dow Theory Letters, Russell includes a chart that points out the prior cycle bottoms since 1949 (1953, 1957, 1962, 1966, 1970, 1974, 1978) which I’ve included below.
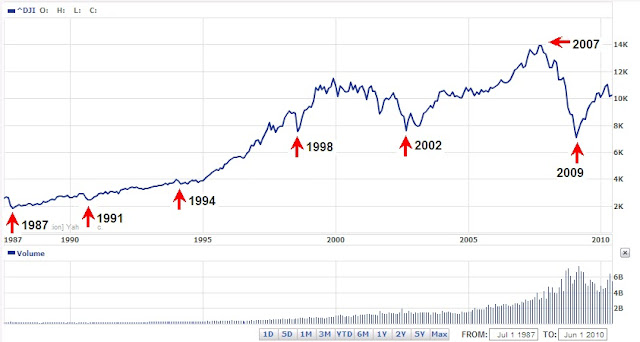
We’ve pointed out that 1982 was the cycle bottom that launched a powerful bull market. However, that bull market wasn’t without interruptions. In the chart below we note the 4 to 4 ½ year cycles that took place along the way (1987, 1991, 1994,1998, and 2002).
Every cycle implies a halfway point that a reversal may take place from. For the 4 to 4 ½ year cycle, this means that the first two years of the cycle are spent going up. No matter whether there is secular bull or secular bear market, the 4 to 4 ½ year market cycle plays itself out for the most part.
Our last major market bottom was March 9, 2009. If my observations on this topic are correct, then we have at least until January 2011 to June 2011 before the half cycle is complete. Afterwards, the market would either trade in a range or establish a well-defined bottom in accordance with the 4 to 4 ½ year market cycle.
Sources:

Dow Theory Q & A

Reader SD asks:
 
"If the Dow appears to hit a peak and begins dropping (Dow Theory bear market indication), is the indicated action to sell your stocks and put your investments into cash until the Coppock curve or other indicators show the market has hit a bottom?"
 
Touc's Reply:
 
There are several approaches to the use of Dow Theory when determining the best time to sell stocks. The first could be to sell all stocks when a Dow Theory bear market is signaled. The second could be to ignore the gyrations of the market and only sell a stock when it is "clearly" overvalued. The final method is the one that I use which involves changing my allocation of stocks.
 
In the first scenario, we will take the perspective of the great Dow Theorists Richard Russell on the application of Dow Theory towards the portfolio when a bear market is signaled. Upon reflection of the market declines from October 2007 to March 2009, Richard Russell said, "...Let's say you are compounding your assets (reinvesting your dividends and interest) beautifully until a full-fledged primary bear market comes along (1973-74 and again in 2008). Within a year or two your assets are cut in half, and all your compounding has gone to waste." By this commentary, Russell seems to imply that an investor should sell all of their stocks at the onset of a Dow Theory bear market indication or risk wiping out tremendous gains that might have been accrued in the process.
 
On November 12, 2007 Richard Russell call the bear market top in the weekly financial publication Barron's. According to Russell, it makes no sense to trifle with the bear market which can plumb depths unimaginable in a period of time that is far shorter than it takes to rise in a bull market. So why risk wasting the power of compounding to a bear market, especially when you "know" it is coming. In this respect, Russell says sell all of your stocks and wait until the next bull market indication to arrive.
 
The second Dow Theory approach to selling a stock is the most commonly misapplied. This approach is supposed to be grounded on the belief that market participants understand values. The misapplication that often occurs is when overvaluation is ignored and a stock isn't sold based on this fact. All Dow Theorists can point to the buying and selling of stocks as being based in the understanding of values. The claim of an understanding of values applies to stocks that are undervalued as well as overvalued. An undervalued stock should be bought while an overvalued stock should be sold, regardless of market condition. Once an undervalued stock has been purchased it could take weeks, months, or years before the stock is overvalued. A stock that has become overvalued should be sold at the earliest opportunity and is often at a new high.
 
In answer to the question of when to sell a stock based on values, the renowned Dow Theorist Robert Rhea had the following to say:
 

"Investors may ask how they can determine the point when stocks are selling far above value and probable earnings. That, indeed, is a hard question to answer because no two men appraise values on the same basis. I can only say that sometime before the peak was reached in 1929, American Telephone and Telegraph [AT&T] (T) was selling around $300 per share. It had a book value of about $128, and its best recorded earnings were in 1929 when the reported net for common was $12.67 per share. Now in 1926 the stock had sold for $151 when its book value was $126, with earnings of $11.95. With its dividend at $9.00, a comparatively small amount was carried to surplus each year. At the price first noted above, the advance in the quoted value of this stock had obviously discounted earnings for many years in the future; moreover, it was selling far above its intrinsic value."

The last method for buying and selling is one that I have combined and modified based on the methods described above which involves taking the Dow Theory signal and allocating more or less money to a given stock. During periods when there is a Dow Theory bull market indication, I invest a minimum of 25% of my capital in a single stock that is at or near a new low. After obtaining what I believe to be "fair profits," I rotate the money into the next "undervalued" Dividend Achiever or Nasdaq 100 stocks. As long as the bull market indication is in effect, I continue to overweight my stock positions in solid companies with proven track records. I'm very flexible in the amount of time that it takes to accomplish the goal of exceeding "guaranteed" money alternatives like treasuries, CDs, money market and savings accounts on an annualized basis.
 
As soon as a bear market signal is given, based on Dow Theory, I shorten the amount of time that I'm willing to wait for an undervalued stock to generate "fair profits." In addition, I cut my minimum position in an individual stock down from 25% to 12% (generally speaking). Basically, I reduce the amount of risk that I'm willing to take in a stock under conditions that might not be as favorable for gains. However, I do not sell stocks outright in anticipation of market declines based on Dow Theory bear market indications. Keep in mind that, under certain circumstances, a bull market can still be in effect after a decline of 20% to 30%. This leaves a lot of room for miscalculation if you automatically sell based on a decline of 10% or more.A review of my 2008 and 2009 transaction histories should demonstrate the value of the approach described above. Follow-up commentary regarding the 2008 transaction history is worth reading as it provides additional insight to the methods now used by the New Low Observer team. It is important to note that, although there was a bear market indication since November 2007, activity in the market did not cease.
 
Again, keep in mind that bear markets are no guarantee of losses in your portfolio. Charles H. Dow, founder of the Wall Street Journal, has said that:
 

"Even in a bear market, this method of trading will usually be found safe, although the profits taken should be less because of the liability of weak spots breaking out and checking the general rise."

I feel that the strategy that we employ is very close to what Charles H. Dow had written about in regards to buying and selling stocks in both bull and bear markets.
 
Art's Reply:
 
Even when a bull market indication is given or the Coppock Curve turned positive, we have to be rational about deploying our capital. A Dow Theory buy indication doesn't signal "all-in" or imply that we can buy stocks blindly. Some stocks performed wonderfully and some lag the market. The same can be said about bear markets.
 
Touc and I bought Altria (MO) in early December 2008 when the company yielded 8%. This transaction occurred during the bear market and took place months before the market reached a bottom. Our sell recommendation netted 13% in less than 2 months.
 
If you'd like to prepare yourself for the coming bear market, I suggest that you pick up a book by Harry Schultz, Bear Market Investing Strategies.
 
Useful References:

Embracing the Economic "New Normal"

According to the Tax Foundation, Americans paid their portion of the Federal tax bill, as measured in number of days out of 365, on April 9th. This was one day later than in 2009. The reason for the reduction in the number of days needed to pay our portion of taxes since 2007 is because of all the stimulus and bailouts that have occurred since the onset of the financial "crisis."
  
If we review the chart on the number of days Americans achieved their "Tax Freedom Day," we find that during years with economic growth we take longer to obtain our freedom. The government sticks it to us when we're making more money. Notice also that our federal budget deficit has gone parabolic for the very same reason that our annual tax bill has gone down.

I've always maintained that this bear market resembles the secular bear period from 1966 to 1982. The chart shows a shocking resemblance between the two periods. In 1968, Tax Freedom Day took place later than the date for the deficit. Likewise, in 1999, freedom occurred after the date for the deficit. After the crossover took place in 1968, our economy hit the high inflation skids thereafter.

For good reason, the 2009 parabolic move in the deficit scares me plenty. If the past is any indication of the future then we're gonna get rampant inflation like never before seen. The irony of this is that after getting slammed in stocks and real estate, most people are seeking safety above all else. The most obvious target for safety is a bank with deposit insurance. Unfortunately, the reformed saver (formerly known as an investor) will get crushed in the coming inflation.
"Markets have risk. So does a savings bank when inflation runs rampant."
Richard Russell. Dow Theory Letters. October 7, 1958. page 2.
What is likely to occur is that the same people who got beaten down in real estate and stocks will get nothing less than clobbered when they are locked in a 6-month certificate of deposit at a local bank. Those with the cash will be reluctant to buy real estate or the "right" stocks. Utility stocks will be the favored choice for "safety" but the unsuspecting will wish they never heard of utility companies as a "safe" investment. Even my favorite Dividend Achievers will be taking it on the chin during high inflation.

My solution to the coming inflation is to embrace it. One way to do this is to read Is Inflation Ending? Are You Ready? This book was written in 1982 by Gary Schilling and Kiril Sokoloff (published in 1983) explaining why the days of double digit inflation were over. This is important because everything that happened after 1983 can easily be verified. In the book, we get insight as to what happens in a deflationary environment which precedes breakneck inflation. In order to understand where we're going we need to know where we came from, the book by Schilling and Sokoloff covers 60% of the high/low inflation equation.

Next, read the book Crisis Investing by Douglas Casey. Casey's book covers all ends of the investment spectrum with a bias towards high inflation environments. While you might not need half of the strategies that are mentioned, Crisis Investing will come in handy when you need a quick reference.

Dow Theory

On October 16, 2009, I wrote an article on SeekingAlpha.com titled “Stock Market Projections,” where I attempted to predict the next low point for the Dow Industrials. In that article I said:
After I ran the numbers, the cycle analysis method indicates that from January 24, 2010 to February 15, 2010 is the next expected low.”
Eerily, the Dow Jones Industrial Average has managed to hit a major low on February 8, 2010. This is almost exactly in the middle of the range where, based on cycle analysis, the Industrials were expected to go. At the time it was my assertion that after hitting the low in February 2010 we could expect that the next move upwards would be to the 12,000 level.
The case for the move upward has been bolstered by the fact that, according to Dow Theory, the Industrials and the Transports have exceeded their January 2010 highs based on the closing price of March 18, 2010. However, as the Industrials have exceeded their March 18th closing price the Transports have not followed through so far.  This type of divergence between the two indexes is generally considered to be a non-confirmation.
The great Dow Theorist Richard Russell (Dow Theory Letters) has spoken at length about non-confirmations in the indexes and how to interpret the trend of the market in this context. According to Russell:
"It is a reasonable practice in areas of non-confirmation or divergence to give precedence to the primary direction. Thus, after a rally in a bear market, when one Average refuses to confirm the other on the upside, the strong presumption is that the next direction of the market will be down. More positive proof is provided if the two Averages then retreat below previous minor decline lows. The converse of this is true in a bull market, and many impressive advances have been “tipped-off” in areas where one Average refused to follow (confirm) the other through an important low point."
Richard Russell, Dow Theory Letters, Issue 102, May 2, 1960, page 2. www.dowtheoryletters.com
We would not be totally satisfied with the bull market indication (within a secular bear market) until the Transportation Index is able to go above 4422.50. However, until that time, we would consider this a bull market that is waiting for a confirmation rather than a potential bear market in the making. While we’re still sticking to a projected Dow Industrials of 12,000, the market has seemed to run out of the explosive bursts on the upside that it once had. Despite this concern, we wouldn’t be surprised of the market truly melted up from the current level.
  • The article on Seeking Alpha titled “Stock Market Projections” is here.
  • For better viewing, the chart in the article is here

Email our team here.

Dow Theory Q & A

A reader writes:
 
"Without the Obama stimulus and intervention from the FED it would already be below 5000. The existing position is totally artificial, unsustainable and downright ephemeral. Any one that claims that this synthetic bull market is sustainable is full of it.
 
"It is interesting to note how much you can derive from the historical shape of a line with zero analysis of why it was that shape. You have not even quoted a single example of a similar pattern resulting in a similar outcome to your predictions. In other words, this is not a scientific approach. It not even a logical approach. I can only conclude that the sole purpose of such analysis is to influence the market in a desired direction. In other words it is a propaganda approach."
 
Our Response:
 
Manipulation is a factor of the market in the day-to-day movement. However, the long-term trend of the market cannot be manipulated as demonstrated from the writings of William Peter Hamilton, former editor of the Wall Street Journal.
 
Using Dow Theory, Hamilton called the top in the stock market on October 25, 1929 in a WSJ editorial titled “A Turn in the Tide.” It should be noted that the comments on manipulation made by William Peter Hamilton were done when it was well known who and when manipulation took place prior to the institution of the SEC.
 
In his book The Stock Market Barometer, Hamilton outlines many methods of manipulations as they took place and its relevance to the overall market. In his book, Hamilton says of manipulation:
 
  • “The market is always under more or less manipulation.” page 37.
  • “Even with manipulation, embracing not one but several leading stocks, the market is saying the same thing, and is bigger than the manipulation” page 42.
  • “Major Movements Are Unmanipulated-One of the greatest of misconceptions, that which has militated most against the usefulness of the stock market barometer, is the belief that manipulation can falsify stock market movements otherwise authoritative and instructive” page 49.
  • “These discussions [of manipulation] have been made in vain if they have failed to show that all the primary bull markets and every primary bear market have been vindicated, in the course of their development and before their close, by the facts of general business, however much over speculation or over-liquidation may have tended to excess, as they always do, in the last stage of the primary swing” page 50.
  • “It has been shown that, for all practical purposes, manipulation has, and can have, no real effect in the main or primary movement of the stock market, as reflected in the averages. In a primary bull or bear market the actuating forces are above and beyond manipulation. But in the other movements of Dow's theory, a secondary reaction in a bull market or the corresponding secondary rally in a bear market, or in the third movement (the daily fluctuation) which goes on all the time, there is room for manipulation, but only in individual stocks, or in small groups, with a well-recognized leading issue” page 73.
Hamilton, William Peter, The Stock Market Barometer, Wiley & Sons, New York, 1922.
Another great Dow Theorist, Richard Russell, editor of the Dow Theory Letter which has been published consistently since 1958, called the market bottom in October 1974 and called the top in November 2007 (read Barron's article here). The extensive history of reasonably accurate and well-documented calls of market direction make examining Dow Theory worthwhile. The purpose of showing Russell’s remarks on the topic of manipulation is to demonstrate that, although there is a distinct difference between the pre-1934 SEC market of Hamilton era and today, the rules, according to Dow Theory, remain the same.
 
In The Dow Theory Letters, Richard Russell reiterates the fact that:
 
“One of the most difficult concepts to get across to subscribers is the concept of primary trend of the market. This may be old hat to my veteran subscribers of 10 or 20 years, but the whole idea of the primary trend bears repeating now.
 
“There are three trends in the market, all working with each other simultaneously. There is the great primary trend, lasting usually a few years up to 15 years or even longer. There is the secondary trend lasting usually a few months up to a year. And there is the minor or daily trend lasting a few days to a few weeks or so.
 
“The minor trend of the market is open to manipulation. This shortest of trends may reflect a news event, a sudden scare, a sunny word from the president or any of a thousand other possibilities.
 
“The secondary trend often reflects a short-lived expansion or recession that the economy or some very major news event. The secondary trend is also open to manipulation, usually on the part of the Fed in that the Fed can make money tight or loose (the Fed can even bring on a recession by restricting credit or the Fed can see a boom by opening the money spigots wide).
 
“The primary trend is the great tidal trend of the market. When the tide is coming in we term it a bull market. When it is going out we call it a bear market. One of the basic tenets of Dow theory is that the primary trend of the market cannot be manipulated. That’s a point that every investor must understand. The primary trend is more powerful than the power of the Federal Reserve, Congress, and the president combined. When the primary trend of the market turns down (as it did early 1973) stocks will decline until the market discounts the worst that can be seen ahead. When the primary trend turns up (as they did in late 1974) the market will rise until the best that can be seen ahead is fully discounted in the price structure.
 
“But the point I want to get across to subscribers is that once the direction of the primary trend is set, the market will fully express itself in the primary direction. The primary trend may be held back for a while, secondary reactions may interrupt the primary trend, but ultimately the trend will run to conclusion, it will express itself fully.”
 
Russell, Richard, Dow Theory Letters, January 24, 1990, Letter 1035, 2
Keep in mind that Dow theory isn’t a cure all for investment success. As aptly stated by yet another great Dow Theorist Robert Rhea in his book “The Dow Theory," he states:
 
“The Dow theory is not an infallible system for beating the market. Its successful use as an aid in speculation requires serious study, and the summing up of evidence must be impartial. The wish must never be allowed to father the thought.”
 
Rhea, Robert, The Dow Theory, 1932, Barron’s Publishing, 26
Rhea is known for having called the market bottom in 1932 with the publishing of the book The Dow Theory as well as in his newsletter Dow Theory Comment. Despite the clarity in the fact that Dow Theory is not “infallible” the point is made that the use of Dow Theory has the significant value of synthesizing all current and foreseeable economic, political, and social information. Rhea quotes Hamilton with the following thoughts:
 
“The Averages Discount Everything -- The fluctuations of the daily closing prices of the Dow-Jones rail and industrial averages afford a composite of all the hopes, disappointments, and knowledge of everyone who knows anything of financial matters, and for that reason the effects of coming events (excluding acts of God) are always properly anticipated in their movements.”
 
Rhea, Robert, The Dow Theory, 1932, Barron’s Publishing, 19
For the fact that Dow Theory is supposed to include all information, there is little reason for me to speculate on the reasons why and how the market will do what I interpret the averages to be saying. Furthermore, the idea that Dow theory is about a bunch of lines is an unfair assessment at best. Suffice to say, Dow Theory is founded primarily on values then market sentiment and finally explained in a technical fashion (using lines.) Those wishing to understand the value component of the theory can find it throughout the New Low Observer website. However, keep reading for more insight on how value plays a role in your investment strategy.

Q & A

Question:

Based on your February 12th article, what's the point of recommending dividend growth stocks if you're just going to recommend selling them once they appreciate by 10%?
In the case of MATW, you're recommending it at a higher price than where you previously recommended selling it. If you just would've held on to it, your position would be worth more and you wouldn't have interrupted your dividend stream.

Answer:

Companies that have a history of dividend increases transmit far more than just the ability to compound income. The purpose of recommending Dividend Achievers is because we believe that companies with a continuous history of dividend increases proves that they are “quality” companies. What is left for us to determine is at what price are we going to acquire quality companies.
As aptly stated by the great Dow Theorist Richard Russell, “Let's say you are compounding your assets (reinvesting your dividends and interest) beautifully until a full-fledged primary bear market comes along (1973-74 and again in 2008). Within a year or two your assets are cut in half, and all your compounding has gone to waste.” (Dow Theory Letters. July 24, 2009. Daily Commentaries. Paragraph 3.) Richard Russell makes this commentary despite his most famous article on the concept of compounding titled “Rich Man, Poor Man: The Power of Compounding.” For this reason, the possibility of compounding a stock’s income is only a last resort if we happen to be wrong about the direction of the stock price after the purchase has been made. Again, we only want to be wrong with “quality” companies since holding on for the long-term is all the more easier with a steady growing dividend.
In the case of MATW, the yield on the stock leaves a lot to be desired in terms of compounding at just 0.90%. In addition, knowing that the historical annual return on stocks, adjusted for inflation, has not exceeded 10% in any 30-year period means that 10% or more in four months should be acknowledged as an exceptional return. Because we don’t ascribe to the mantra of diversification (see our article “Diversification: It Really Doesn’t Matter”), our investments tend to be concentrated enough to justify the transactional costs that we’d incur to get in and out of a stock.
On our website, we clearly point out that only stocks with a designation of “Investment Observation” are companies that we feel strongly about the prospects. The reiteration of Matthews Corp. (MATW) was for the purpose of alerting interested parties to put the company through their own research regiment as the price declines.
For our August 4, 2009 sell recommendation of MATW, we indicated that, “selling this stock now also generates a return 11 times greater than the amount of the dividend yield if the stock was held for a whole year.” We consider the fact that your return on investment should demonstrate the capacity to exceed what would be received if held for a full year. We also compare the performance of the stock against what would have been received if the same funds were held in 30-year Treasuries or guaranteed investment vehicles.
Although our approach is for the purpose of trading stocks, we don’t take the idea lightly. In the description of our site we state clearly, “this website is intended to give new insights on a low risk approach to trading in dividend paying stocks for tax deferred accounts with the ability to buy and sell individual stocks. This website is not intended for regular or non-qualifying accounts however, the strategies and stocks mentioned can be used for non-qualifying accounts with the understanding of the consequences of potential short-term capital gains as well as the need for exceptional documentation for IRS purposes.”

I hope this give a little more insight about our approach. Thanks again for a great question.

-Touc

Article Commentary and Reply

The following is a response by a reader regarding the February 8, 2010 article outlining all of the transactions from 2008:

Reader Comment:

I am assuming that by "portfolio" is meant all investable funds among all asset classes like stocks, bonds, commodities, etc.

1) You had 94% of all investable funds in Wesco at one time which to me appears extreme concentration in one asset class, regardless of how confident one is about the prospects. And since the future is unpredictable, I believe the risk/reward outcome unnecessarily becomes a hostage to the "Black Swan" events.

I do note that you had a timely and efficient loss control mechanism in place and that you sold out at a minimal loss. But that might be because you had such a huge overweight in that one stock, forcing you to watch it like a hawk. Had it been a small weight, you might have acted differently, even not having sold out and thus made a much greater profit in absolute terms since Wesco climbed 10% to 15% higher soon after you sold it.

This is a good example of why single, huge overweight concentration in one security is generally counterproductive because we are forced into taking quick actions based on short term volatility and transient perceptions of risk.

2) Almost ten times out of a total of 40 trades you let your realized losses exceed 10% and in one case even go as high as 46%. I am not averse to enduring high unrealized losses in special cases wherein we are convinced about the intrinsic value of the investment, and are willing to "ride out the storm". This is a part of the process of investing. However, I wonder what intrinsic value, or a miraculous turnaround, you were seeing holding Fannie May during the summer and early fall of 2008. Granted, you had a small allocation to this name at the time, but the expectations surrounding this trade appear to me to be speculative in nature.

3) After September every trade was a losing trade (except the three with small profits), all the way through the end of the year. And that was not in the least unusual, since being in the stock market was simply not the right strategy at the time. I am not sure what the Dow Theory was telling us around this time -- during this period of extreme volatility and spreading risks throughout the investment landscape globally. Maybe you can throw some light with respect to the Dow Theory in this context, for this period. And also whether any other asset allocations were considered and rejected. (For instance, 4Q08 provided bountiful profits in the Treasury bonds with minimal volatility and low risk.)

Touc's Reply:

Yes, by portfolio I mean all investable funds that are transacted through a brokerage firm. The percentages given are specific to any and all cash holdings in all brokerage accounts. As part of a truly diversified portfolio, I hold physical gold and silver, real estate and a minority ownership in a restaurant.
Your points about extreme concentration are quite valid, on the surface. However, as you’ll note in my article “Diversification Doesn’t Matter,” the general declines of the market are going to take out an investor no matter how diversified. In fact, the more diversified the account within the realm of stocks, the more likely diminished returns will occur.
Regarding the issue of “black swan” events, as a student of stock market crashes and panics, I have built in the prospect of a “black swan” in every transaction. First, I assume that I will lose at least 50% of my investment before entering into an investment. Second, I accept the reality of the situation based on such thinking. Third, by having an undiversified portfolio, I can clearly address scenarios that exceed losses of 50% or more without a deleterious impact on my mental faculties. With this in mind, I can better determine the risks that I’m about to take.
The matter of Wesco Financial (WSC) is an interesting one to point out. There are at least a couple thoughts, which I will try to elucidate upon. First and foremost is the transaction that preceded the WSC trade. In less than 2 months I was able to advance 96% of my portfolio by 10% with Family Dollar Stores (FDO). All that mattered to me was to not wipe out the gain immediately after accomplishing such a feat. As pointed out, I probably would have acted differently had the position been smaller. The tendency of most diversified (smaller postions) investors is to watch calmly as their entire portfolio declines until the market or stock cannot fall any further, at which point the investor panics and sells at the bottom.
The next issue of concern regarding the Wesco (WSC) trade is the missed gains that followed after selling the stock. This is something that is most pronounced with the entire sell recommendations that I have given on both Dividend Inc. and New Low Observer. In my opinion, investors face two types of greed, one for profit and one for loss. Under the conditions of both forms of greed, only losses can become permanent. I seek to mitigate both extremes of greed for what I am ultimately able to keep. I am unanimous (wink) in declaring that I seek mediocre returns or “fair profits.” In some respects, my willingness to accept missed gains and 50% losses keeps me righted. The fact that my returns have exceeded the downward spiral of 2008 with positive gains is only icing on the cake.
To be honest, I never felt the strain of getting in or out of a stock quickly enough. There never was a sense of being rushed. No wondering in the middle of the night what is going to happen to my outsized trade? After all, either I’m right or I am wrong and the markets will tell me soon enough. For this reason, I was never overwhelmed by the sense that somehow I missed an opportunity. I kept my eye on all the current and former Dividend Achievers and stuck to my core competency.
Fannie Mae (FNM) wasn’t a situation of whether the company had any intrinsic value or not. I simply speculated that the government assurance would bolster the share price of FNM. I was completely wrong about the FNM speculation. However, I ensured that the losses didn’t exceed the gains from the (AIG) speculation that occurred on 2/28/2008, 9/23/2008 with 82% and 38% respectively. Also, I didn’t want to wipe out the Bear Stearns (BSC) speculation of March 14, 2008 with 26% of the portfolio. Another matter of concern is the fact that by September 29, 2008, I had amassed gains of 41% in the same portfolio. I knew I was “playing” with house money. FNM just happened to be one (of many) that didn’t go my way.
The question of my take on Dow Theory in the last quarter of 2008 is very clear. In a Dividend Inc. article titled “A Key Point for the Market” dated October 6, 2008, I stated the following*:
Today the Dow Jones Industrial Average has fallen to the minimum of 9525.32. This exceeds the Dow Theory projection of 9531.11 posted on this blog on September 17, 2008. Nothing that has happened thus far is surprising according to Dow's Theory. It becomes academic at this point to suggest that we are either going to the 7197.60 level…
On September 17, 2008, in an article titled “Dow Theory on the Dow Industrials,” I stated the following*:
After today's stock market action the Dow Jones Industrial Average closed at the level of 10,609.66. This is below the 50% Principal as devised by E. George Schaefer. The 50% principal indicates that if a stock or index falls below this level it will fall, at minimum to the 2/3 level of Dow's Theory. Right now the 2/3 level for the Dow Jones Industrial Average is 9531.11. If the Dow falls below the 2/3 level the next stop will be 7,197.60.
Although Dow Theory had given a bear market signal, as indicated by Richard Russell’s November 2007 Barron’s article, I stuck to my core competency which is current and former Dividend Achievers with some speculation in gold and silver stocks. Dow Theory, for me, has acted as a guidepost for the market’s general direction, which affects the concentration of each individual stock. However, if Dow Theory were interpreted as Charles Dow has indicated (an approach which I reiterate throughout the site), investors would do well to heed Dow’s remark that “even in a bear market, this method of trading will usually be found safe…
Thank you for your sincere interest and the opportunity to discuss, at length, the ideas that went into some of my trades during 2008.
-Touc
*anyone interested in the articles dated September 17, 2008 or October 6, 2008 can send an email to me. Those who regularly received the RSS feed or automatic updates should look under the respective dates that the feeds or emails went out from Dividend Inc. I hope you still have those articles.

AngloGold (AU) and Other SA Stocks Offer No Margin of Safety

If we're on the brink of a breakout to gold at $9,000 an ounce as UBS claims (source: Financial Times, requires registration) then let the party begin. By my own calculations, after halving my worst case scenario, gold could go as high as $9,414.16. Yeah, I know, make an outrageous claim and cement your fame. However, I have a logical explanation for my belief that a run up in gold is possible.

Confidence in my math on how gold could plausibly get to $9,000 is actually less important than the wait that we're in for to get to such a level. After all, the rise from $35 an ounce in 1969 to $800 an ounce in 1980 took a lot of twists and turns. I personally believe that we'd see a collapse in the price of gold and other related commodities before we move to the insane levels that I mentioned earlier.

If you compare the yields on gold stocks today to the 1970's you'd think we were on different planets. As an example, Barrick Gold (ABX), a "domestic" producer, has a dividend yield of 1% while AngloGold Ashanti (AU) has a paltry yield of 0.40%. DRDGOLD (DROOY), the old Durban Deep, has the massive yield of 1.4%. In the list of gold stock provided by Richard Russell, only 3 stocks sported no dividend. None of the publicly traded South African gold producers have dividend yields that provide a margin of safety.

In an earlier posting, I scoffed at the notion of gold stocks paying a dividend just to get investors into the market. Despite that concern, it doesn't stop me from believing that if we are really in a long term bull market in commodities (inflationary period) then it would certainly be nice to get compensate for the wait.

Keep your mind open to the prospect that even if some gold stocks are paying a dividend just to get speculators in, there might be a chance that the current run up in gold is a repeat of the early stages of a genuine gold bull market. If you happen to find gold stocks with such outrageous yields then let me know, I'm always interested (only those with earnings please.) Touc.

*See my note on commodities in the comment section of my September 12, 2009 posting.


Please revisit Dividend Inc. for editing and revisions to this post.