Category Archives: Sell Recommendations

Sell Electronic Arts and Symantec

On our April 27, 2012 Nasdaq 100 Watch List, we highlighted Electronic Arts (EA) and Symantec (SYMC) as stocks of interest out of the 17 equities listed (found here).  Now that both stocks have gained just under +50% in 13 months, we believe the value component has been taken out of these companies.  In keeping with Dow’s Theory of seeking fair profits and while there are still willing buyers, we recommend selling these stocks at the earliest opportunity.

image

Electronic Arts achieved two of the three downside targets that we had while Symantec achieved two of the four downside targets.  Anyone interested in maintaining positions in these stocks should consider selling the principal only.

Activision Blizzard is a Sell

On December 24, 2012, Activision Blizzard (ATVI) was among the top three stocks on our Nasdaq 100 Watch List (found here).  At the time, we said the following:

“Activision Blizzard (ATVI) was on the watch list on August 12, 2011 (found here) when the stock was trading at $10.71.  No sooner than ATVI was on our list that it rose +30% to the November 8, 2011 high.   ATVI is now selling at the same price as August 2011, however, the stock has a lower P/E ratio and a lower P/B ratio.  If we suppose that the stock has not moved up at all in the last year, this could be considered an undervalued stock.”

Activision is up over +39% in only 5 months.  With such excessive gains in such a short period of time, it is necessary to consider selling the stock.  For investors who want to take advantage of any additional upside potential, selling only the principal is an acceptable alternative.

image

BMC Software is a Sell, Meets Upside Target

On December 16, 2011, BMC Software (BMC) was at the top of our Nasdaq 100 Watch List (found here).  At that time, we said the following:

“BMC Software (BMC) has not only fallen to a new 52-week low, it has also fallen to a 2-year low. Based on the decline so far, according to Dow Theory, BMC could retrace to the $40 level. Fair value for the stock is at $44.86. The $40 level seems reasonable within the next year for BMC even though it is 20% above the current price. The most obvious downside target for BMC is the October 2008 low of $22. A decline of $22 would equal a loss of 33%.

“It should be noted that despite the market turmoil of 2008, BMC did not fall to the 2006 low. Additionally, the long term support line as drawn in the chart for BMC indicates that $22 ultimate price to watch for. If BMC were to replicate the percentage decline from the May 2008 top to the October 2008 low, the stock would decline to a price of $31.11.

“The Punchline: Those interested in BMC could split their investments into two transactions. The first purchase could be done between Friday’s closing price and $31.11 and the second if the stock declines to the $22 level. No additional shares should be bought if the price increases.”

Since December 16, 2011, BMC fell as low as $31.65 and has achieved the current price of $45.36.  However, it has been indicated that Bain Capital is willing to pay $46.25 for BMC.  While competing offers for BMC may exceed the $46.25 price, we feel that the gains achieved, at the current price, requires investors to sell the stock at a +36.75% gain from the 2011 low.

image

Coming soon for subscribers:

  • Gold Stock Indicator
  • Insurance Watch List

Akamai Is a Sell

After the market closed yesterday, Akamai (AKAM) reported that “Third quarter revenue of $345 million, up 23 percent year over year, GAAP net income of $48 million, up 14 percent year over year; or $0.27 per diluted share, up 17 percent year over year, Normalized net income* of $79 million, up 24 percent year over year; or $0.43 per diluted share, up 26 percent year over year.”  The news seemed to caught the market flat-footed as the stock had been selling off from the October 8, 2012 high of $39.60 down to the closing price of $36.11 on October 24, 2012.

Last year, on October 21, 2011, we posted our recommendation of Akamai was among the best candidates for consideration from our Nasdaq 100 Watch List.  At the time, AKAM was trading at $23.85 and we said the following of the stock:

“…we believe it is worth considering Akamai from a Dow Theory perspective for any upside potential that might remain for the company. According to Dow Theory, so far the average price paid by investors, as opposed to speculators, is $36.45. This indicates the point at which an investor, over the last year, considers to be the “fair value”. This implies that the stock, at maximum could gain nearly 52% in due time. However, taking into account Charles H. Dow’s claim that in a bear markets, investors should only expect half of what would be considered “fair value” in a bull market, we think that in the next year Akamai could rise to the $30.15 level before faltering. We have acquired share of Akamai with the expectation that the stock will decline by at least 50%, at which point we will reconsider buying additional shares.”

Dow Theory seems to have honed in on all of the technical support and resistance levels for Akamai price.  Surprisingly, AKAM’s price rose from $23.85 to $30.43 before faltering in early November 2011.  This reaction was within 1% of our estimate where we thought that the stock would have experienced some resistance within a rising trend.

At the current time, according to Dow Theory, AKAM has upside targets of:

  • $42.31
  • $46.25
  • $50.19

And downside targets of:

  • $33.13
  • $25.92
  • $18.65

However, now that Akamai has resoundingly risen above the Dow Theory fair value level of $36.45, any additional rise of the stock is a gift.  Because our tax-deferred investing (and qualified accounts) strategy  employs Charles H. Dow’s approach of “seeking fair profits,” we are recommending that holders of Akamai consider selling the principal investment in the stock if purchased based on our October 2011 recommendation and pursue alternative investment opportunities in companies that are reasonably undervalued on a relative basis.

image

Those not interested in following through with our sell recommendation can feel comfortable knowing that Akamai is a reasonable holding with a +55% margin of safety since our initial review of the stock. 

Sell Abbott Laboratories (ABT) at the Market

There comes a time when great companies reach a sell range.  In our view, Abbott Laboratories (ABT) just approached that mark for us.

After highlighting the fundamental and technical aspects of Abbott back at $47 on September 24, 2009, (article here) and actively accumulating the stock near the January 31, 2011 low (article here), the stock has risen 47% since 2009 and 53% since 2011 (excluding dividends). The annualized return is equivalent to +13.89% since 2009 and +28% since 2011. The stock outpaced the S&P 500 by roughly 13% from our 2009 review and by 37% since our early 2011 article.

image

Let’s revisit our original assessment of Abbott in 2009. The stock was trading at 14x earnings, 10x cash flow, and sporting a 3.4% dividend yield. Today, Abbott is currently trading at 22x earnings, 12x cash flow, and 3.0% dividend yield. The table below shows the relative change that has occurred since 2009.

2009 2012 % Chg
P/E 14 22 57%
P/CF 10 12.4 24%
Yield 3.4% 3.0% -12%
Price $47.00 $68.90 47%

While our valuation model shows that Abbott is undervalued at a 3% dividend yield, 13x earnings, and 10x cash flow, we’d rather recommend selling the stock only if purchased near the $45-$47 price range as indicated in our prior articles.

Those not interested in following through with our sell recommendation can feel comfortable knowing that ABT is a great long-term holding with a minimum 40% downside cushion since our 2009 posting.  It’s no doubt that income investors can hold shares of Abbott knowing that dividend will be safe and will continue to grow.  Anyone who bought Abbott at $47 would be sitting on yield on cost of 4.3%. Not too bad when 10 Year T-Bill is close to zero.

In any event, we believe it may be a good time to off load shares of Abbott by either selling the entire position or selling the principle while letting the profit runs.

A Deteriorating Situation at Warner Chilcott (WCRX)

After our sell recommendation of Warner Chilcott (WCRX) on April 30, 2012 (found here), the stock price had been on a 3-month slide.  The stock had declined by $4.02, or -24%, by the first week of August.  

However, on August 8th, after the announcement that the company was no longer for sale, WCRX found some traction and started to move higher and rose from $12.63 to as high as $14.09, nearly +12% in a single month.

image

After the close of trading on September 5, 2012, seemingly out of nowhere, it was announced that the “main” shareholders and company management were going to sell nearly half of their holdings, or nearly 42.9 million shares, in the company (found here) and (found here).  Among the management that is selling shares is CFO Paul Herendeen who will be letting go of 30.9% of the 1 million shares that he owns.

The “main” shareholders, Bain Capital Partners, JPMorgan Partners, and Thomas H. Lee Partners, took Warner Chilcott “…private in 2005 for about 1.6 billion pounds ($2.1 billion)…” (Bloomberg source).  After waiting only a year, the “main” shareholders took WCRX public (raising  $1 billion) as the stock sold below the offering price of $15 (September 21, 2006 IPO data).

According to Value Line Investment Survey dated July 13, 2012, Warner Chilcott has a fair value of $25.76. However, although gyrating wildly, the total debt has increased from 86% in 2006 to 95% in 2012 and a book value that has declined nearly -83% since going public.

News of insider selling and the failure to sell off the company couldn’t have come at a less opportune time.  We believe that there is more downside left with WCRX and reiterate our sell recommendation of April 30, 2012.

Sell American States Water (AWR) at the Market

We believe that now is the time to consider selling American States Water (AWR) at the market based on a few indications in the water utility industry.

First, the price of American States Water (AWR) at point 2 has achieved the prior high that was set in 2007, at point 1, in the chart below.    Even the most minor downturn from the all-time high suggests that there is considerable downside risk, especially if the stock was bought at or near our March 7, 2010 recommendation of water utilities (found here).

image

Another factor being considered as part of our sell recommendation of AWR is that the water utility sector has experienced a triple top as indicated by the best performing industry ETF, First Trust ISE Water Index (FIW), since our March 7, 2010 recommendation of water utilities in the chart below (FIW is the blue line).

image

We have to hold our nose to the idea that First Trust ISE Water Index is the best representation of water utilities since its composition is hardly a pure play on the sector. We’ve included the comparison of other water ETFs including the Guggenheim S&P Global Water Index (CGW), PowerShares Water Resources (PHO), and PowerShares Global Water (PIO) to demonstrate the relative weakness of the sector overall.

Finally, the recent run-up in AWR has helped the stock to achieve gains that have exceeded the returns of the Dow Jones Industrial Average (^DJI) from the March 8, 2010 to the present.

image

The overall under-performance of AWR as compared to the Dow Industrials in prior periods suggests that the stock should be sold to take advantage of the exceptional gains since April 2012.

Some will likely argue that there is more upside potential based on the recent move in AWR.  A favorite argument for water utilities is that water is fast becoming “scarce.”  However, our prior disclaimer on the issue of water scarcity, from our October 31, 2009 recommendation of AquaAmerica (found here), encapsulates the problems faced by the industry:

“Although this is a water utility [AquaAmerica (WTR)] and water is critical to life, investors need to understand that companies in this industry aren’t a ‘sure thing.’ The biggest reason for this is that when, and if, water becomes scarce, government regulators will step in to take over (nationalize) what should otherwise be sold at the most profitable price (thereby curbing wasteful consumption.) There is literally an upside cap on profitability to a company like this [AquaAmerica (WTR)] due to the critical importance of the resource being sold.”

The lows experienced after the 2009 bottom and the nearly 3 1/2 year stock market rally indicates that certain positions need to be pared down.  Recommendation to buy American States Water (AWR) based on their fundamentals are likely reflections of past performance being projected too far into the future and would not necessarily hold up in the short to medium-term.  We believe that American Water Works can be acquired at more favorable prices going forward.

Sell Target (TGT) at the Market

Target (TGT) last appeared on our June 25, 2011 U.S. Dividend Watch List (found here).  At the time, TGT had a dividend yield of 2.59% and was trading at $46.33.  However, Fitch rating agency had just downgraded the company from A to A-.  At the time, we said that TGT was undervalued with a yield of 2% and “…even more attractive at a 2.59% yield.”  Slightly more than one year later, Target is now selling at a 52-week high.

The chart below reflects just how much the market has come to realize the relative undervalued nature of TGT.

image

Because Target (TGT) has gained +37.11% in capital appreciation plus +2.59% in reinvested dividend income, we recommend selling the principal portion that was invested and seek out new opportunities found on our current dividend watch lists.

West Pharmaceutical Services (WST) Requires Your Attention

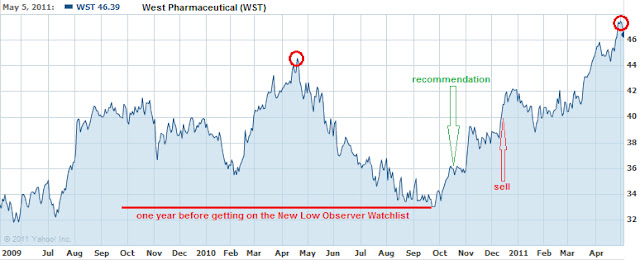
We couldn’t help but notice that West Pharmaceutical Services (WST) is now trading at $46 a share.  This is 28.86% above our investment observation on October 17, 2010, when West Pharmaceutical Services (WST) was at the $36 level.
Our recommendation of WST came after the stock price fell within 1% of the 52-week low and was at the top of our bi-weekly NLO Dividend Watch List for Friday, September 24, 2010.
Our sell recommendation of WST came on December 11, 2010.  In the sell recommendation, we indicated that the stock had upside resistance at the $44 and $52 level.  Our annualized return based on that sell recommendation was approximately 40% from October 17th to December 11th.
We believe that those who had bought WST on our NLO Dividend Watch List in September or our specific recommendation back in October should reconsider the merits of continuing to retain ownership of the stock.  From our original recommendation of the stock to the current price, the annualized return would be a little over 50%.  Putting this in perspective, the appreciation achieved so far is equivalent to 13 years of dividend income.  These gains could soon prove to be fleeting based on the signals provided by the recent stock activity.
In the chart below, you will find that West Pharmaceutical Services (WST) has come off of its high of $47.96 on May 2, 2011.  This activity is not dissimilar to the price activity that occurred in April of 2010.  The peaks experienced in April and May could reflect seasonal activity associated with this particular stock.
While the possibility of West Pharmaceutical Services (WST) going above the previous highs is not out of the question, we’d rather opt for readers of our site to preserve the gains that have been accomplished thus far.  We will have an updated NLO Dividend Watch List shortly and recommend rigorous due diligence on the new opportunities that are presented.
Please revisit New Low Observer for edits and revisions to this post. Email us.

Sell Cephalon (CEPH) at the Market

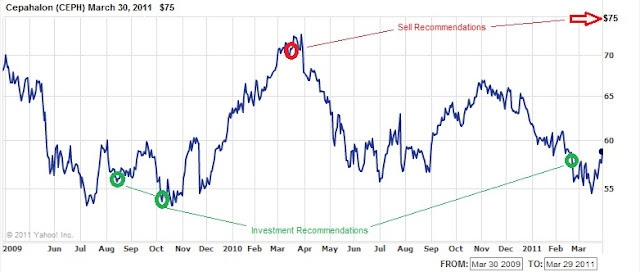
Our premise that exceptional values starts with quality companies trading near a 52-week low has been proven again. Just like our calls on Beckman Coulter (BEC), Wesco Financial (WSC), Genzyme (GENZ) and many others, our articles on Cephalon (CEPH) have shown that quality cannot be ignored.
In a series of articles starting in August of 2009, we recommended considering the purchase of CEPH at $56.61. Subsequently, in March 2010, we recommended selling CEPH at around the $71 price range, which was two dollars short of the high at $73. Finally, on February 11, 2011, we recommended that followers of this site reconsider CEPH at $58.99. Soon after our recommendation, CEPH declined to the most recent low of $57. A month and a half later, Cephalon (CEPH) is getting a hostile bid from Valeant Pharmaceuticals (VRX) for approximately $73 a share.
Although our cursory examination of the offer by VRX seems generous, we believe that CEPH probably should, and could, be worth closer to $115 rather than $73. Regardless of this concern, we believe that 23% in 46 days affords us the opportunity to recommend selling the stock at the current price. There are too many opportunities on our Nasdaq 100 and Dividend Watch Lists. Based on our last recommendation, the annualized return on this position would be close to 200% in a tax-deferred account.
Please revisit New Low Observer for edits and revisions to this post. Email us.

Sell ExxonMobil (XOM) at the Market

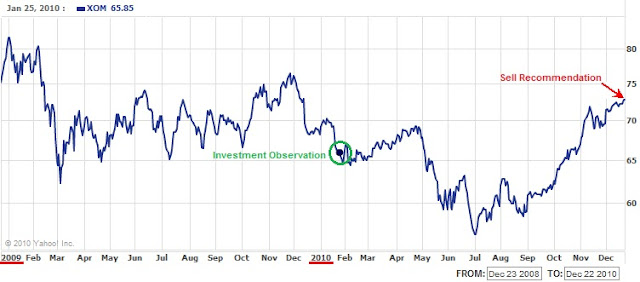
It is now time to recommend that ExxonMobil (XOM) be sold at the market. The stock has performed modestly since the Investment Observation was issued on January 25, 2010. It is highly recommended that anyone who bought the stock based on our insight should re-read the posting. Shortly after our recommendation, XOM fell 15% before heading higher.

In the pursuit of "seeking fair profits" the returns that this stock has provided within the last 333 days say that it is necessary to consider alternative opportunities. The key to investment success and a key principle of economics is to seek the best alternatives.

ExxonMobil (XOM) was recommended when it closed at $65.90 on January 25th. Based on yesterday's closing price of $72.80, XOM has gained 10.47%. If we include reinvested dividends then the gain was 14.84%.

In our observation of the stock on January 25th we were specific in how long the shares might decline and by what percentage we expected the stock to fall further. We said the following:

“…based on the prior Coppock Curve indications, XOM is expected to remain unchanged or fall for another three to six months by about 11% to 18%.”

Five months later, ExxonMobil reached the final bottom on July 2nd at a price of $55.94. As mentioned before, this was a decline of 15% from date of the Investment Observation.

In addition to giving a specific time frame for where the stock would go, we gave a strategy for if you wanted to buy the stock at the January 25th price. The strategy that we outline said the following:

If we were to invest in stocks the way that Charles H. Dow would then we would buy half of the intended amount now and purchase the second half if the price declines. For example, let's say that you wanted to invest $13,180 in this company. What you would do is buy $6,590 worth of stock now (approximately 100 shares) and hold the stock if the price goes up. If the stock goes down then you would invest the remaining $6,590 at the next level that you felt was ideal. This approach works well regardless of the market that you're in as long as you set aside the amount that you intend to invest before making the first purchase. Also, after making the first investment never invest the second half somewhere else.”

Based on the quality of the observation and a strategy for the investment, readers of this site should have gains that exceed our worst case scenario gain of 14%.  The maximum possible gain on this position, including dividends, is 30.42%.  We hope that there are those who took advantage of this opportunity. 

The annualized return on this position would be close to 14.84% assuming that only purchase was made at the time of the initial Investment Observation. Selling this stock now generates a return of 5.56x greater than the amount of the dividend yield if held for a full year. Additionally, the 14.84% gain exceeds the return on a 30-year treasury purchased on January 25, 2010 by 3.25x.

Those not interested in following through with our sell recommendation can feel comfortable knowing that XOM is a great long-term holding with a 14.84% downside cushion since our investment observation. As the price of XOM rises, it should be noted that the stock faces significant upside resistance at $75, $80 and $95.

As we have indicated in the purposes and function of this site, our goal is to:
  • Maximize the annual yield of each trade.
  • Reduce the time between buying and selling of each stock.
  • Exceed the annual yield of government guaranteed alternatives in each trade.
Investment observations are intended to be a starting point for investigating a quality company at a reasonable price. It is hoped that after doing the background research you can buy the stock at a lower price. Ideally the stock should be held in a tax-deferred account and should not consist of less than 20% of your holdings. Personally, we prefer holding only 2-3 stocks at a time.

For a portfolio of $10,000 with a 20% position that gains 14.84%, the impact on the entire portfolio is a little over 2%. This is contrasted with the same portfolio with a 5% position that gains 14.84%, the impact on the entire portfolio is slightly over half a percent (0.50). By choosing conservative dividend increasing stocks at or near a new low, the odds of success are increased in your favor making the assumed increase in risk worthwhile.

Sell recommendations are intended to deal with the short-term reality of the market. The tracking of the Sell recommendations are the worst case scenario if you happen to have bought a stock at the time the Investment Observation was made (please avoid making this mistake.) We aim for modest but consistent returns, therefore we are happy with 9-12% annual gains.

It is always recommended that when selling a stock, one should not place stop orders, limit orders or orders after hours as detailed in our article "Automatic Orders Don't Provide Protection." This leaves the seller in the position of being vulnerable to the whims of the market makers. Instead, place your sell orders only as a market order during market hours. Some would complain that a market order during market hours might leave some profits on the table. However, we would rather leave some money on the table rather than have it taken away from us by the trades that are placed by institutions and market makers.

Please revisit New Low Observer for edits and revisions to this post. Email us.

Sell West Pharmaceutical Services (WST) at the Market

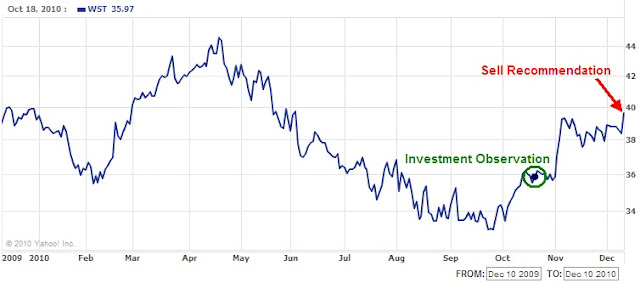
It is now time to recommend that West Pharmaceutical Services (WST) be sold at the market. The stock has performed moderately since the Investment Observation was issued on October 17, 2010. It is highly recommended that anyone who bought the stock based on our insight should re-read the posting. For the most part, West Pharmaceutical (WST) retained the recommended market price and moved higher from there.
In the pursuit of "seeking fair profits" the returns that this stock has provided within the last 55 days say that it is necessary to consider alternative opportunities. The key to investment success and a key principle of economics is to seek the best alternatives.
West Pharmaceutical (WST) was recommended when it closed at $35.97 on October 18, 2010. Based on the most recent closing price, WST has gained 10.06% (from the $36 price.)
The annualized return on this position would be close to 60%. Selling this stock now generates a return of 5.29x greater than the amount of the dividend yield if held for a full year. Additionally, the 10.06% gain exceeds the return on a 30-year treasury purchased on October 18, 2010 by 2.56x.
Those not interested in following through with our sell recommendation can feel comfortable knowing that West Pharmaceutical (WST) is a great long-term holding with a 10.06% downside cushion since our investment observation. As the price of WST rises, it should be noted that the stock faces significant upside resistance at $44 and $52. The current strong interest in Beckman Coulter (BEC) (article link) will provide significant support of West Pharmaceutical (WST) for the next couple of weeks.
As we have indicated in the purposes and function of this site, our goal is to:
  • Maximize the annual yield of each trade.
  • Reduce the time between buying and selling of each stock.
  • Exceed the annual yield of government guaranteed alternatives in each trade.
Investment Observations are intended to be a starting point for investigating a quality company at a reasonable price. It is hoped that after doing the background research you can buy the stock at a lower price. Ideally the stock should be held in a tax-deferred account and should not consist of less than 20% of your holdings. Personally, we prefer holding only 2-3 stocks at a time.
For a portfolio of $10,000 with a 20% position that gains 10.06%, the impact on the entire portfolio is 2.01%. This is contrasted with the same portfolio with a 5% position that gains 10.06%, the impact on the entire portfolio is 0.50%. By choosing generally conservative dividend increasing stocks at or near a new low, the odds of success are increased in your favor making the assumed increase in risk worthwhile.
Sell Recommendations are intended to deal with the short-term reality of the market. The tracking of the Sell Recommendations are the worst case scenario if you happen to have bought a stock at the time the Investment Observation was made. We aim for modest returns, therefore we are happy with 9-12% annualized gains.
It is always recommended that when selling a stock, one should not place stop orders, limit orders or orders after hours as detailed in our article "Automatic Orders Don't Provide Protection." This leaves the seller in the position of being vulnerable to the whims of the market makers. Instead, place your sell orders only as a market order during market hours. Some would complain that a market order during market hours might leave some profits on the table. However, we would rather leave some money on the table rather than have it taken away from us by the trades that are placed by institutions and market makers.

Please revisit New Low Observer for edits and revisions to this post. Email us.

Sell Northern Trust (NTRS) at the Market

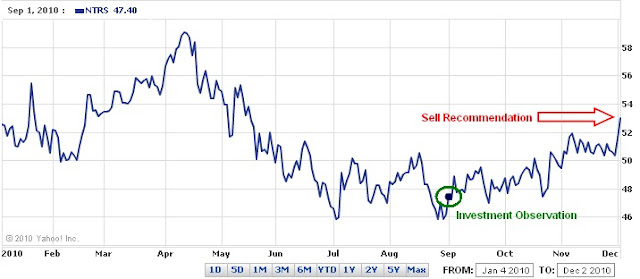
It is now time to recommend that Northern Trust (NTRS) be sold at the market. The stock has performed moderately since the Investment Observation was issued on September 1, 2010. It is highly recommended that anyone who bought the stock based on our insight should re-read the posting. For the most part, Northern Trust retained the recommended market price and moved higher from there.
In the pursuit of "seeking fair profits" the returns that this stock has provided within the last 94 days say that it is necessary to consider alternative opportunities. The key to investment success and a key principle of economics is to seek the best alternatives.
Northern Trust (NTRS) was recommended when it closed at $47.26 on September 1st. Based on this morning’s price of $52.18, NTRS has gained 10.96% (including reinvested dividends.) By catching the stock eight days before the ex-dividend date, we were able to boost the total return from 10.41% to 10.96% a difference of 5.28%.
The annualized return on this position would be close to 43%. Selling this stock now generates a return of 4.62x greater than the amount of the dividend yield if held for a full year. Additionally, the 10.96% gain exceeds the return on a 30-year treasury purchased on September 1, 2010 by 3x.
Those not interested in following through with our sell recommendation can feel comfortable knowing that Northern Trust is a great long-term holding with a 10.96% downside cushion since our investment observation. As the price of NTRS rises, it should be noted that the stock faces significant upside resistance at $56 and $59.
As we have indicated in the purposes and function of this site, our goal is to:
  • Maximize the annual yield of each trade.
  • Reduce the time between buying and selling of each stock.
  • Exceed the annual yield of government guaranteed alternatives in each trade.
Investment observations are intended to be a starting point for investigating a quality company at a reasonable price. It is hoped that after doing the background research you can buy the stock at a lower price. Ideally the stock should be held in a tax-deferred account and should not consist of less than 20% of your holdings. Personally, we prefer holding only 2-3 stocks at a time.
For a portfolio of $10,000 with a 20% position that gains 10.96%, the impact on the entire portfolio is 2.19%. This is contrasted with the same portfolio with a 5% position that gains 10.96%, the impact on the entire portfolio is 0.548%. By choosing generally conservative dividend increasing stocks at or near a new low, the odds of success are increased in your favor making the assumed increase in risk worthwhile.
Sell recommendations are intended to deal with the short-term reality of the market. The tracking of the Sell recommendations are the worst case scenario if you happen to have bought a stock at the time the Investment Observation was made (please avoid making this mistake.) We aim for modest returns, therefore we are happy with 9-12% annualized gains.
It is always recommended that when selling a stock, one should not place stop orders, limit orders or orders after hours as detailed in our article "Automatic Orders Don't Provide Protection." This leaves the seller in the position of being vulnerable to the whims of the market makers. Instead, place your sell orders only as a market order during market hours. Some would complain that a market order during market hours might leave some profits on the table. However, we would rather leave some money on the table rather than have it taken away from us by the trades that are placed by institutions and market makers.
Please revisit New Low Observer for edits and revisions to this post. Email us.

Sell Transatlantic Holdings at the Market

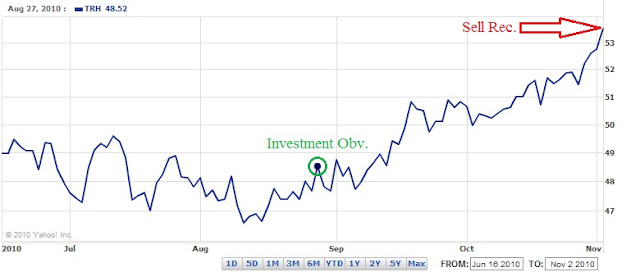
It is now time to recommend that Transatlantic Holdings (TRH) be sold at the market. The stock has performed moderately since the Investment Observation was issued on August 27, 2010. It is highly recommended that anyone who bought the stock based on our insight should re-read the posting. Shortly after our recommendation, TRH fell as low as -1.75% before heading higher.
In the pursuit of "seeking fair profits" the returns that this stock has provided within the last 68 days say that it is necessary to consider alternative opportunities. The key to investment success and a key principle of economics is to seek the best alternatives.
Transatlantic Holdings (TRH) was recommended when it closed at $48.52 on August 27th. Based on today's closing price of $53.52, TRH has gained 10.78% (including reinvested dividends.) By catching the stock eight days before the ex-dividend date, we were able to boost the total return from 10.31% to 10.78% a change of 4.56%.
The annualized return on this position would be close to 57%. Selling this stock now generates a return of 6.73x greater than the amount of the dividend yield if held for a full year. Additionally, the 10.78% gain exceeds the return on a 30-year treasury purchased on August 27, 2010 by 2.92x.
Those not interested in following through with our sell recommendation can feel comfortable knowing that TRH is a great long-term holding with a 10.78% downside cushion since our investment observation. As the price of TRH rises, it should be noted that the stock faces significant upside resistance at $53.76, $54.00 and $55.59.
As we have indicated in the purposes and function of this site, our goal is to:
  • Maximize the annual yield of each trade.
  • Reduce the time between buying and selling of each stock.
  • Exceed the annual yield of government guaranteed alternatives in each trade.
Investment observations are intended to be a starting point for investigating a quality company at a reasonable price. It is hoped that after doing the background research you can buy the stock at a lower price. Ideally the stock should be held in a tax-deferred account and should not consist of less than 20% of your holdings. Personally, we prefer holding only 2-3 stocks at a time.
For a portfolio of $10,000 with a 20% position that gains 10.78%, the impact on the entire portfolio is 2.16%. This is contrasted with the same portfolio with a 5% position that gains 10.78%, the impact on the entire portfolio is 0.54%. By choosing generally conservative dividend increasing stocks at or near a new low, the odds of success are increased in your favor making the assumed increase in risk worthwhile.
Sell recommendations are intended to deal with the short-term reality of the market. The tracking of the Sell recommendations are the worst case scenario if you happen to have bought a stock at the time the Investment Observation was made (please avoid making this mistake.) We aim for modest returns, therefore we are happy with 9-12% annual gains.
It is always recommended that when selling a stock, one should not place stop orders, limit orders or orders after hours as detailed in our article "Automatic Orders Don't Provide Protection." This leaves the seller in the position of being vulnerable to the whims of the market makers. Instead, place your sell orders only as a market order during market hours. Some would complain that a market order during market hours might leave some profits on the table. However, we would rather leave some money on the table rather than have it taken away from us by the trades that are placed by institutions and market makers.
Please revisit New Low Observer for edits and revisions to this post. Email us.

The Anatomy of a Bear Market Trade

One Investment Observation that we made is worth reviewing because it encompasses many fundamental techniques necessary for accounting for risk in bear markets. Our recommendation of Bank of Hawaii (BOH) on January 12, 2009 at the price of $37.76 is a prime example of risk adjusted investing. We’d like to think that this was among the boldest and well-planned recommendations that we’ve done. In this analysis, we’ll point out the specific elements that made this Investment Observation so unique.

First and foremost, the recommendation of a bank would seem to be completely out of left field for us since we have always intentionally shied away from the banking sector. Making our recommendation more usual was the fact that we were in the midst of a literal and figurative collapse in the banking industry. In January of 2009, it was hard to tell where the fire wasn’t going to spread next. After all, if you’d seen Fannie Mae, Freddie Mac, AIG, Merrill Lynch, Bear Stearns, Washington Mutual, and Lehman go off the deep end, who is to say that other regional banks weren’t next? However, to see such a well-run institution like BOH closing in on a new low was very hard to resist.

A favorite default reaction for a stock that is near a new low is to look at Value Line Investment Survey for a specific piece of information. In the legend box provided by Value Line, it indicates the most reliable measure of historical mean price that the stock trades at. Sometimes that measure is based on cash flow, earnings, earnings divided by interest rate, book value etc. Regardless of the measure, Value Line’s estimated mean value is quite reliable. If the stock is above or below the mean figure it helps provide a target that we can expect the price to revert to at some point in the future. The quality of the mean figure hinges on the quality of the stock. If for some reason there doesn’t seem to be any consistency in the Value Line estimate then we discard it outright and only use Dow Theory’s fair value as the substitute mean. However, we have found the Value Line estimate to be reasonably reliable for the majority of stocks that we track.

In our assessment of Bank of Hawaii, Value Line indicated that the mean price for BOH was 14 times earnings. At the time, full year 2008 trailing earnings were at $4.06. We only use full year trailing earnings; estimates of the future are not accepted unless they are lower than the previous full year’s data. The figures provided by Value Line gave us a mean price of $56.84 for where we could expect the price of Bank of Hawaii to eventually revert to. Depending on the quality of the company, our dreams are fulfilled if the stock in question goes back to the mean. This is also in accordance with Dow’s Theory that all stocks tend to gravitate to their fair value.

In terms of Dow Theory, we indicated that there were three downside targets. From our analysis of previous Dow Theory moves, we indicated that Bank of Hawaii demonstrated the capacity to retrace “…from the peak to between the 2nd and 3rd retracement levels…” This led us to believe that a purchase of the stock might be required “…between $30.70 and $20.87.” The actual lowest point reached on a closing basis for Bank of Hawaii on March 9, 2009 was $25.70. This was $0.08 less than the exact middle of $30.70 and $20.87.

Our next point of reference was if we were forced to hold the stock for “the long term.” Using this perspective, we surmised that Bank of Hawaii would have to be held for 15 years “...to recoup all [or some] that you have initially invested if you reinvest the dividends.” This is a big leap of faith considering that the dividend could be cut at any time. However, because BOH had demonstrated a consistent history of increasing dividends for over 30 years, it warranted the benefit of the doubt on this matter.

Since the stock price of Bank of Hawaii had been in a rising trend for an extended period of time it was difficult to gain new insight from looking at the chart. However, what we did notice was the surge in volume of shares traded when the stock was nearing a low. Given this pattern, we said:

“All we need now is a good collapse in the price to reassure us of the opportunity to buy. That opportunity might come in the wake of BOH falling below the 52-week low of $36.32 reached on November 21, 2008.”

Shortly afterwards, the stock price experienced an even greater surge in the volume which was accompanied by a steep decline. As mentioned before, Bank of Hawaii (BOH) had a closing low price of $25.70. Being tepid on the idea of holding a stock longer than necessary, we issued a sell recommendation on August 6, 2009.

Under the following scenarios, investor gains would have varied greatly if:

  • bought at the observed price of $37.76 and sold on the recommended sell date, the gain would have been 19.47% on an annualized basis.
  • bought at the low of $25.70 and sold at the top, the annualized gain would be 54%
  • bought at the observed price of $37.76 and held to the present, the approximate gain would be 10.40% on an annualized basis.

Although we outlined exactly what eventually happened, we could never take credit for actually buying at the bottom and selling at the exact top. However, we can show that our ballpark estimates for Bank of Hawaii (BOH) reaching the mean price was fairly accurate. The peak in the price at $53.53 was within 6.18% of our price target of $56.84. Our estimated time to buy the stock between $30.70 and $20.87 was met with a closing low of $25.70 or $0.08 off of the exact middle of the two price points. Finally, we were able to usurp the 4.80% dividend yield by selling the stock with an annualized gain of 19%. We didn’t have to hold the stock “for the long term” to realize such opportunities.

Naturally, there are some critics who suggest that hiding behind “quality” stocks is only a ruse to speculate rather than invest. We understand and grapple with this consideration constantly. We know that most market commentators in the media lionize “The Warren Buffett Way” and vilify traders. Other critics might argue that if we “knew” so much then why didn’t we recommend Citigroup (C) or Bank of America (BAC)? However, our goal was, and always will be, to determine the lowest risk way to invest in the stock market with the widest margin for error with an annualized gain of 10% on each investment.