Category Archives: speculation

Undoing The Work of Those Who Got it Right in Real Time

On August 3, 2024, Kathleen Tyson, a former central banker, said the following:

“Chinese authorities and resolution experts have been managing down the real estate bubble for over four years. The IMF is frustrated that they can’t collapse China today as they collapsed Japan in 1990. Japan never recovered. China is avoiding that trap skilfully. Growth at 5% is stable.”

image

We unpack this commentary because it reveals much about efforts to end speculation in real estate and stock markets and highlights how a false narratives can gain traction in our world of revisionist history.

First, the follow-up commentary to the original posting from Kyle Ferrana:

image

If “…the IMF didn’t offer to give/loan China money, they suggested that China pay $1 trillion of its own money” then the IMF only suggested a policy that China has been implementing on its own for a very long time when it come to declining markets.  So, there was no implied snub of the recommendations from the IMF.  Instead, it was simply a recommendation that will emerge on the scene eventually.

Now to the commentary of Kathleen Tyson:

“Chinese authorities and resolution experts have been managing down the real estate bubble for over four years.”

If we count back to four years ago, that would bring us back to 2020. However, we do know of the October 17, 2017 speech by Xi Jin Ping where he said that property is not for speculation.

image

“…The principle was first introduced by China's top leaders at an economic conference last December, as the country sought to crack down on rampant speculative buying in its property market through a flurry of government curbs (Reuters).”

image

"Houses are built to be inhabited, not for speculation," Xi said in his address at the 19th Party Congress Wednesday in Beijing.”

The October 2017 reference to the December 2016 commentary gives us the impression that the beginning policy to ease prices and end speculation began in 2016, at least.

What is the point of determining when China started “managing down the real estate bubble?”  If China is doing a great job controlling their economy and real estate market downward,  then how did it become a real estate bubble to begin with?

When and what did the government do to manage down the property market? China initially tried to suppress real estate speculation back in 2003/2004 & 2010:

  • "…since 2003 the Chinese central government has rolled out a series of regulations and policies to suppress excessive speculative investment in major Chinese housing markets so as to rein in country-wide soaring housing prices." (Jia, Shijun jiashj@gzhu.edu.cn Wang, Yourong rewangyr@cufe.edu.cn Fan, Gang-Zhi fan10@konkuk.ac.kr. “Home-Purchase Limits and Housing Prices: Evidence from China.” Journal of Real Estate Finance & Economics, vol. 56, no. 3, Apr. 2018, p. 387.)
  • "On April 17, 2010, the State Council, China’s cabinet, issued new rules for lowering the temperature of its booming housing markets, which are called ‘New Ten Clauses’. According to these new rules, cities whose housing prices rose excessively fast were requested to curb irrational housing demand and real estate speculation by restricting the number of homes each household can purchase and raising the minimum down-payment requirement and the mortgage loan rate."
  • "One distinctive tool in “New Ten Clauses” is home-purchase limits (HPL afterward), which restrict the number of houses that each householder can purchase." (Jia, Shijun jiashj@gzhu.edu.cn Wang, Yourong rewangyr@cufe.edu.cn Fan, Gang-Zhi fan10@konkuk.ac.kr. “Home-Purchase Limits and Housing Prices: Evidence from China.” Journal of Real Estate Finance & Economics, vol. 56, no. 3, Apr. 2018, p. 387.)
  • "Municipal governments in China established direct control of the supply of urban land in August 2004." (Peng, Liang, and Thomas Thibodeau. “Government Interference and the Efficiency of the Land Market in China.” Journal of Real Estate Finance & Economics, vol. 45, no. 4, Nov. 2012, pp. 919–38.)

So how did that 2003/2004 effort to end speculation of real estate go in China?

image

The impression from the chart above should suggest that though well intended, housing prices in China continued to climb higher. Worth noting is the fact that the peak in China coincided with most global real estate markets, in spite of the government’s efforts to suppress rising prices and speculation.

As is standard practice of governments at the lows, in 2009, China introduced policies to offset prior speculation curbs, which of course had no impact on the inexorable trend.

"There are two short time periods of exceptions when home purchases were encouraged. One happened in 2009, just after the global financial crises, and the other was in 2015 when the government intended to mitigate the problem of housing storage." (page 387)

Jia, Shijun jiashj@gzhu.edu.cn Wang, Yourong rewangyr@cufe.edu.cn Fan, Gang-Zhi fan10@konkuk.ac.kr. “Home-Purchase Limits and Housing Prices: Evidence from China.” Journal of Real Estate Finance & Economics, vol. 56, no. 3, Apr. 2018, pp. 386–409.

The 2009 policy to prop the falling housing market was as follows:

“The central bank has lowered interest rates significantly, and the banking authority has loosened conditions on mortgage agreements, including lowering the down-payment requirements. (Clouse, Thomas. “Fuel For the Growth Engine.” Global Finance, vol. 23, no. 2, Feb. 2009, pp. 34–35.)."

After 2009, the property speculation continued as it did for much of the world.

image

We’re almost certain that the government in China thought, “look how quickly the market turned based on a minor tweaking of the policy on housing.”  The conclusion must have been that if they can manage a reversal from the 2009 low, then they certainly can manage a reversal from a rising trend.

So, let’s go back to our feeble attempt at determining the beginning of the government efforts to end or curb speculation in real estate.  Remember, we said, “…the beginning policy to ease prices and speculation began in 2016…”  However, we already know that as early as 2003, China was trying to slow down the speculative nature of the property market and yet, property prices increased anyway.

This brings us back to the comment by Tyson:

“Chinese authorities and resolution experts have been managing down the real estate bubble for over four years. The IMF is frustrated that they can’t collapse China today as they collapsed Japan in 1990. Japan never recovered.”

How is it possible that the government couldn’t manage the speculation and rise but suddenly can manage the decline?  This, coincidentally, is exactly the process that Japan took in trying to deal with their property bubble. We’re reminded of the words of the great Dow Theorist Richard Russell on this specific topic in 1990, well in advance of actual total collapse of Japan.

image

“History tells us that deflation has a habit of getting out of control.”

Keep in mind that, at the time, the Bank of Japan promised to end speculation in stocks and real estate before 1990.  Except, after 1990, the theme of the central bank for Japan was one of doing everything they could to get real estate back to the former levels.

image

This parallel history between China in 2007 and Japan in 1989 (U.S. in 1929 & Germany in 1926) highlights how institutions think that they can alter the outcome.

Interestingly, suggesting that the IMF is the reason for the fall of Japan is a denial of Japan’s strength and weaknesses. Japan actually did earn the rise that followed from 1950 to 1989.  Also, the rise ran too high and too far.  That is how bubbles work, historically.

Image

Suggesting that the IMF is the reason for the decline in Japan denies all the experts who accurately predicted the subsequent crash.  Experts like Tetsuo Tsukimura, who predicted that the Nikkei would decline to 8k-6k while the index was at or above 30k.

Image

Or Bill Emmott, with his 1989 book titled The Sun Also Sets who suggested that “"Japan is, despite all that has been written and said to the contrary, a country that, just like any other, is affected by human nature and market forces…”

image

People worked really hard for the accomplishment of analyzing the situation correctly.  To suggest that the reason for the decline of Japan’s economy was due to a global government agency like the IMF, which many agree, routinely gets their analysis and policy wrong, undoes all the hard work of those who got it right in real time.

See also:

Observations of Penny Stocks–Viable Strategy

Is there a sensible way to speculate in penny stocks? We examined an approach to reduce risk while increasing success in penny stocks.

Our approach starts with a list of Nasdaq companies that have regained listing compliance by meeting the $1.00 minimum bid price requirement. We obtained this information through Google Search, company press releases, or Nasdaq press releases. The time frame for this assessment is from 2019-2020. Keep in mind that 2020 experienced one of the largest declines and rebound.

The first table shows a summary of the result broken down by various time frame. The second table contains individual stock detail.

Speculation in Penny Stocks Summary

The average rate of return, for this frame, was around 100% if we purchase and hold for approximately 9-12 months. Most of the gained came occurred in 2020.

Results based on individual holdings varied widely. To highlight the key to success, we can look at Seanergy Maritime Holdings (SHIP) which lost virtually all its value (-97%) and Kopin Corp (KOPN) which gained 575% in one year. An equally weighted purchase of these 2 companies would have produced exceptional results.

The reason this strategy can lead to a profitable trades is driven mainly by the lopsided risk and reward profile. While some stocks lost nearly all their value, others gained more than +100%. While success rates (positive return) hover around +50%, the uneven profile of risk reward makes this strategy viable.

Although the duration of this study was limited to 2 years, which include down and up cycle, we conclude that this strategy is a viable way to identify and possibly speculate in penny stocks. However, the key to success is diversification and one must purchase and hold as many stocks as possible over the studied timeframe.

Reference:

Bitcoin: September 2019

In our June 27, 2019 posting we had a downside target of $8,530.33.  On September 25, 2019, Bitcoin achieved a low of $7,944.33.  Below is our assessment of the remaining downside risk.

image Continue reading

Speculative Observation: Cephalon Inc. (CEPH) at $62.42

The new year brings new challenges and opportunities. The first opportunity for this year may come from Cephalon (CEPH) which engages in the discovery, development, and commercialization of products for central nervous system, inflammatory disease, pain, and oncology therapeutic areas. It competes against GlaxoSmithKline plc (GSK), Johnson & Johnson (JNJ), and Sepracor Inc. Because the company doesn't pay a dividend, the New Low Observer team has to classify such a security as a speculation.

CEPH came onto our radar when we began compiling the new low data back in July when the stock was trading around $57. This was 8% above the 52 week low of $52.55. At the low, CEPH was trading at less than 15 times earnings. Although appearing to be risky, selected stocks at or near their low offer investors the opportunity to investigate quality companies for potential price increases. Our concept is laid out in the "Buy Low, Sell High" article.

CEPH has a market cap of $4.6 billion dollar. The relatively small size compared to its rivals doesn't discourage us. We only care about the market cap as a means for liquidity when buying and selling the stock. CEPH earned $3.62 per share over the last 12 months and thus has a price to earnings ratio (P/E) of 17 and a forward P/E of 10, an extraordinarily low multiple. Low P/E multiples imply that investors are paying less for every dollar of earnings (more on our view of P/E). CEPH has a book value of $28.71 per share. At $62, price-to-book is north of 2. A positive operating cash flow of $232.48M is a plus but a negative free cash flow is one of my concern ($-12.71M).

Fundamentals aside, the stock may have discounted all the negative news based on the chart pattern. In 2009, Cephalon dropped 19% as opposed to the Dow Industrials which rose 19%. Unlike the Dow which hit the yearly low in March, Cephalon bottomed in July and formed what appears to be a base. This pattern is prominent because it shows that the stock failed to move either up or down and traded in range between $60 and $53. Any break above $60 or below $53 will reveal its potential direction of the stock. Sure enough, the stock broke above $60 in late December and will look for that to be a support for the stock. The momentum indication also turned bullish as the 50-day moving average crossed the upward sloping 150-day moving average as indicated in the chart below.

Another indicator I like to refer to is the Coppock Curve (click here for more on the Coppock Curve). For Cephalon, the curve dates back to 1993. The table below shows my findings.

Date Price 3 Mo After % Change
May-95 9.81 24.25 147%
Feb-98 12.00 10.63 -11%
Sep-98 7.31 9.00 23%
Mar-99 8.75 17.38 99%
May-03 45.16 44.35 -2%
Sep-05 46.42 64.74 39%
Aug-08 76.62 73.48 -4%

The average percentage gain if you sell three months after the buy indication is 42%. Excluding the 1995 data, it is 24%. We are waiting for the indicator to turn for a possible buy signal.

A buy strategy would be to purchase this stock as close as possible to $60 or the 50 day moving average which is dynamic and constantly changing. Use the Coppock indicator as another gauge to buy and watch your gains or losses closely. - Art

Speculation Observations: Mattson Technology (MTSN) at $2.65

Mattson Technology (MTSN) is a supplier of equipment to Semiconductor producers (i.e. Intel). Some of their competitors are Applied Materials (AMAT), Lam Research (LRCX), and Novellus (NVLS). These are 2 billion dollar plus companies versus a 130 million dollar company. Market cap doesn't tell me anything about valuation of the company, so I would ignore that figure for now.
Macro View
When the economy recovers, people feel better and they go out and buy a computer from suppliers like Dell or HP. These computer suppliers then have to ramp up their production and order more computer chips from Intel or Samsung. A demand surge triggered Intel to boost production by expanding their production capacity by purchasing more tools from the likes of Applied Materials or Mattson. This is what generally happens when the economy recovery takes place.
Market Exposure
In 2008, 19% of MTSN revenue came from Canon and 10% came from Samsung (from 2008 Annual Report). Because 90% of MTSN's revenue comes from overseas, this company is truly international company. The largest market they served is memory, which is estimated to be around 70% of their revenue. As you may guessed from going to Fry's or Best Buy, USB memory sticks sell for next to nothing. It's appropriate that this market has seen a fair share of margin contraction (lower profit). This may be the reason why the share price of Mattson and its competitors who are exposed to memory got cut in half.
Valuation
Mattson is currently trading around the $2.50 to $3.00 range. They hold $1.56 cash per share and $2.24 book value. As a result, you have a tech company with NO DEBT, trading at roughly 1.2x book value. That fits Benjamin Graham's formula. Tangible book value (this exclude IP value) is at $3.16 at the end of 2008. Because the company has negative earnings and no dividends, we can only assess valuation based on book value. Using Morningstar valuation tool, you see that over the prior of 10 years, the average trough book value is 1.2.
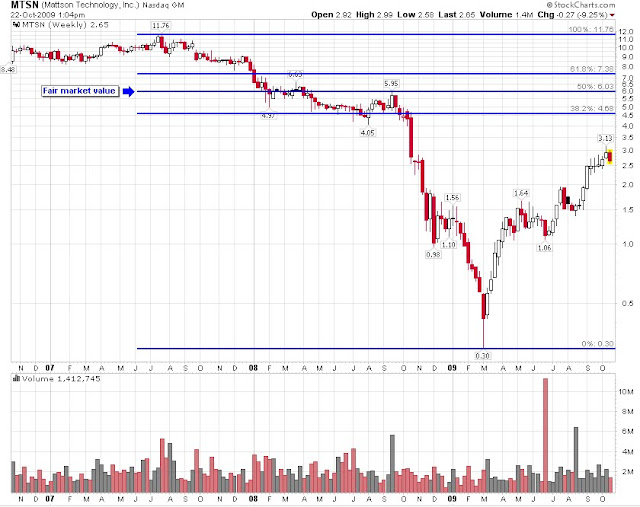
Some of the things I am concern about are negative earnings for this year and the next, possible burn in cash flow, and market liquidity issues. The company traded as high as $11.76 in 2007 then dropped to $0.30 in 2008. Assuming that you bought at the low and sold at $2.50, you would have gained 700%+ on your money. Such extreme low valuation will not likely return because the credit market have recovered somewhat.
So how do I come up with a fair market value for Mattson? Simple calculation based on Dow Theory suggest a fair market price of $6.03. The calculation is simple, take the peak price of $11.76, plus the absolute low of $0.30, then divide it by 2. That's the fair market value based on the Dow Theory interpretation. The chart below shows a graphical representation of from the peak to the most recent trough.
What You Need to Buy?
If you plan on buying MTSN as a speculation, here are things you need.
  • Strong and Healthy Heart for the up and down market. Don't be surprised if the price falls to $1.50 range.
  • Money you can "throw away". This is a speculation at best, so make sure you can lose it and still be ok.
  • Time. This company will need time to work through the current economic environment. It is safest to assume that the price will not revert to $6 simply because I wrote about it. The market will decide that.
Once again, this observation is on the deep end of the speculation pool. I've selected a stock that I believe has a lot more room on the upside but downside should be apparent based on the $0.30 low. Please do your homework and manage this speculation wisely.
Art

Disclosure: None

Follow-up Article:

A Second Look at Cephalon Inc. (CEPH)

Speculative Observation
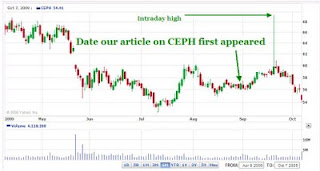
It is just our luck that Cephalon Inc. (CEPH) did exactly what we thought would happened based on the chart pattern in our August 27, 2009 article. In that posting, we said that we thought that Cephalon would experience a price breakout starting on the September 5th. The bias that we had in the article was clearly in favor of a stock price rise in the breakout formation. Part of our justification for this was due in part, on the fact that CEPH was, according to our metrics, relatively undervalued. However, we didn't know when and by how much the stock would rise.

On September 21st, Cephalon rose to an intraday high of $69.30, far exceeding our expectations for the stock in the short term. Because this stock does not pay a dividend we could not make a recommendation of this company as an investment observation. It appears that the speculative observation that we gave was appropriate for the recent moves in the price. However, the stock is now approaching the 52-week low again.
Below are the revised figures for the Dow Theory downside targets (since the upside takes care of itself):
  • $40
  • $31.66
  • $14.40
  • $6

For the reasons above, we highly recommend that you re-consider the article written on August 27th. With a $4 billion market cap, this stock should be among your choices of new speculative opportunities. Art and Touc.

Fannie Mae (FNM) and Freddie Mac (FRE) Fraud

In my article titled "Delisting of GSEs Looms Large" published on February 21, 2009, I discussed the fact that as Fannie Mae (FNM) and Freddie Mac (FRE) remained under $1, the prospects were that we'd either see the companies delisted from the NYSE or that the price would skyrocket. Not long after writing the article, the stock of FNM and FRE fell as low as $0.35 on March 9th. In that February article, I said the following:

"Look for a boosting of the share price to ridiculous levels (anything above $1) or go literally to zero in the next delisting notification process."

Soon after falling t0 $0.35, Fannie Mae and Freddie Mac briefly, on a closing and intraday basis, went above $1 on March 19th and then promptly fell from there. According to the New York Stock Exchange, spend six months under $1 and you get delisted. As strange as it may seem, September is exactly six months away from the month of March.

One reader of this blog, Ron, poignantly remarked, "...it seems to me the exchanges are constantly bending their own rules about delisting, extending grace periods, etc. Especially in this case the govt will probably be leaning on the exchanges not to delist." My response was, "...there is little need to do this (bend the rules.) If you're the government, and you don't know anything about fiscal responsibility, you'll more than likely feel compelled to waste the money and artificially inflate the stock price." Furthermore, I specifically stated that this was going to be "one of the biggest speculations in history."

Well, as promised, the U.S. government proved to be as gullibull as has been the case since the beginning of time. In an article titled "Fannie, Freddie Avoid Delisting as Price Triple" published by Bloomberg.com, you get the sense that there is a collective exhaling about the notification that the companies would not be delisted. Strangely, FBR Capital Market's Paul Miller seemed indignant at the thought that the Fannie and Freddie stock price went up. Miller, a banking analyst, said that the rise was "unjustified" and that there was "no fundamental value remaining" in the two GSEs.

I say to Mr. Miller (with tongue firmly in cheek), the threat of being delisted was a completely justifiable reason for Fannie and Freddie stock to go up in value. The government had already gamed the markets by reverse splitting AIG, so it would be challenging to commit the same fraud twice on the investing public in such a short time.

Also Mr. Miller, if Fannie and Freddie are delisted, the market for all bad mortgages cannot be absorbed by the taxpaying public through the GSE conduit. That means these two companies are incredibly valuable. Mr. Miller, maybe Fannie and Freddie are not valuable to you but they are definitely valuable to the banks that are receiving bailouts in the front door and dumping their trash on the taxpayer through the back door. Silly Mr. Miller, still talking about notions like fundamental values and such.

We have witnessed the all too familiar quality known as predictably irrational behavior of the government and the financial markets. In many respects, Ron was right, the rules were bent to favor those in powerful positions. When the NYSE says "The World Put Its Stock in Us," they should have also added that it is the best exchange that money can buy. After all, the NYSE should be held criminally for allowing such blatant fraud to reign on their exchange. Instead, they looked the other way in the face of clear manipulation and malfeasance.

It is just our luck that history repeats so well and so often in financial markets. This is the reason why the addressing of this matter of the delisting of the GSEs was so predictable. The maneuvers that I've described have happened so many times in the remote and distant past with far more inferior technology that it's laughable. The more things change the more they remain the same...and that ain't no cliche in the financial markets. Touc.

related articles:


Please revisit Dividend Inc. for editing and revisions to this post.