Category Archives: TEVA

Teva Pharmaceuticals (TEVA) Now Slated to Acquire Cephalon (CEPH)

The plot thickens with news that Teva Pharmaceuticals (TEVA) is going to buy Cephalon (CEPH) for $81.50 (article here).  Teva’s offer exceeds Valeant Pharmaceuticals’ (VRX) previous bid of $73. 

We originally recommended Cephalon (CEPH) in August of 2009.  After our August 2009 recommendation of Cephalon, we recommended selling the stock near the high of $71 in March 2010 before the decline to $56.  In February 2011 we recommended readers consider Cephalon at the $58 level.  From there the stock has appreciated 39% in less than 3 months.  The most recent run of Cephalon was followed by a sell recommendation on March 30, 2011 at slightly above $75.  We wagered that despite the prospect of getting a sweetened offer closer to the true value of the company, we didn’t need to argue with a nearly 200% annualized return.

Our recent recommendation of Teva Pharmaceuticals (TEVA) on April 5, 2011 puts a twist on our selling of Cephalon.  It has been reported that Cephalon’s board rejected the Valeant offer and has already accepted the Teva offer. 

Interestingly, both Teva Pharmaceuticals and Valeant Pharmaceuticals got a boost in their share price at the announcement of the acquisition of Cephalon.  Typically, the acquiring company shares would decline at the announcement of a major purchase.  This seems to indicates that the market recognizes the positive impact that Cephalon will have on the ultimate acquirer.

Investors seeking the qualitative elements of Cephalon but cannot justify the purchase at the current price can hedge their bets by buying Teva at the current undervalued levels and gain the growth prospects clout of both companies. Obviously, this assumes that the deal goes through between TEVA and CEPH. If the deal with Teva and Cephalon doesn’t go through, we still believe that Teva represents a solid value at the current price. 


Please revisit New Low Observer for edits and revisions to this post. Email us.

Sundry Items

  • Biogen Idec (BIIB) and Teva Pharmaceutical (TEVA) are doing a dance as both are members of the Nasdaq 100 index. As one stock is at a new high the other is reaching a new low. The two-step that is being done by the stocks is quite amazing. Back in October 30, 2009, we pointed out that the concentration of biotech stocks at a new low meant that they were possible takeover candidates. From that list in 2009, GENZ and CEPH were actually tendered buyout offers. 3 of the remaining 5 biotechs have had gains of 40% or more since then. The remaining two stocks, Amgen and Gilead Sciences, are essentially at break even. BIIB has been the leader in terms of price appreciation with a gain of over 100% since October 30, 2009. At that time TEVA was near a new 52-week high. However, BIIB’s recent success is actually impacting the performance of TEVA since both companies are involved in the development in MS drugs. TEVA is now on our new low list for the Nasdaq 100 and should be consider as a top acquisition candidate for your portfolio. Anyone who bought BIIB based on our watch list from October 2009 should now consider securing a large portion of the gains and possibly funding the purchase of TEVA with the proceeds.
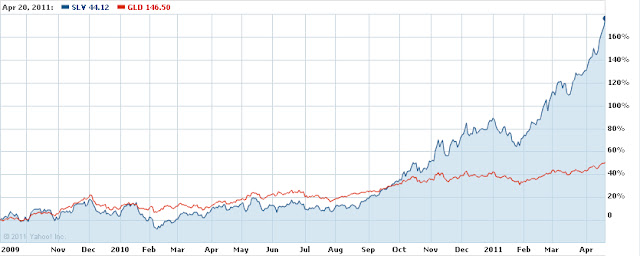
  • Our September 5, 2009 article titled “Silver Should be the Focus” recommended that anyone interested in investing in gold should instead put there investment funds towards silver. The chart below reflecting the silver (SLV) and the gold (GLD) ETF demonstrates the accuracy of our recommendation and highlights what we believe is likely to come. Those interested in determining an entry point should reference our latest article on April 14, 2011 highlighting the downside targets for precious metal stocks based on the Philadelphia Gold and Silver Stock Index (XAU).

  • The results are in and our article titled “A Comparison Between Dividend Strategies” has demonstrated, so far, that the New Low approach has returned 19.52% while the list of stocks we compared ourselves to has returned only 1.39%. We believe that, although the two list have similar companies, the quality and timing has made the difference in performance. As a note, we only made the comparison because the author of the other list indicated that it was for the purpose of trading. In our view, stocks that can be considered for trading are worth comparing since we only aim for 1-year performance.

Please revisit New Low Observer for edits and revisions to this post. Email us.

Speculation Observation: Teva Pharmaceutical Industries (TEVA) at $50.27

A reader indicates that Teva Pharmaceutical Industries (TEVA) is a great stock although there is some confusion as to why the company is trading at such a low price. We took a look at Teva and came up with the following thoughts.
According to Value Line dated January 14, 2011, Teva has paid a dividend since 2000. The average dividend yield when the stock price peaked has been 0.69% and the average dividend yield at the low price has been 1.06%. Based on the close of trading on April 4, 2011, Teva has a dividend yield of 1.74%.
In order for the stock to trade at the historical normal low price/high yield; Teva should trade at $82.07. If Teva were to eventually trade back at the historical high price/low yield, then the stock potentially could rise to $126.
We’re going to take the conservative route and assume that Teva’s new low yield/high price is at the 1.06% yield level. This suggests that the upside target for the stock is 64%. We arrive at this conclusion assuming that all is lost for Teva to ever go back to the 10-year dividend yield range between 0.69% and 1.06%.
An additional consideration is the growth rate of the dividend, which has averaged 26% in the last 5 years. Looking ahead, we considered the most conservative approach to estimating what the stock would be if Teva were to increase the dividend by only 10%. At the historical low price/high yield (1.06%), Teva would be worth $86.79 the same time next year. Any amount below $86 and Teva would be extremely undervalued, all things being equal, or about to go out of business (it’s possible).
As with the historical dividend yield range, the price to book ratios (P/B) are correspondingly out of alignment. In the last 10-year, Teva’s P/B ratio at the highs has averaged 4.41x. At the low in the stock price, the P/B ratio has normally traded at 2.65x. With Teva trading at 2.05x book, the price could easily rise by 30% to $65 just to achieve the prior low price to book ratio range.
For the NLO team, the downside risk is much more important than the upside prospects. According to Dow Theory, Teva has the following downside targets:
  • $47.06 (fair value based on 7/2006 low)
  • $41.30
  • $29.77
Charles H. Dow indicated that the fair value of a stock is the average price that is paid by investors. The fair value is the point at which an investor, as opposed to speculators, will consider buying or selling a stock. The fair value that we’ve arrived is based on the low of July 2006. If Teva were to decline below $47.06, the prospects for $29.77 become almost inevitable. Our concern is that the macro conditions favor a market decline, which would put additional downside pressure on Teva.  As Teva declines below fair value we will provide an updated estimate of fair value upon request.

Please revisit New Low Observer for edits and revisions to this post. Email us.

Nasdaq 100 Watch List

Below are the Nasdaq 100 companies that are within 20% of the 52-week low. This list is strictly for the purpose of researching whether or not the companies have viable business models. Although theses companies are very risky, they provide significant opportunity to outperform the market in the coming year.
Symbol Name Price P/E EPS Yield P/B % from Low
CSCO Cisco Systems, Inc. $18.85 14.26 $1.32 0 2.26 1.56%
AMGN Amgen Inc. $52.24 10.91 $4.79 0 2.04 3.94%
CEPH Cephalon, Inc. $58.63 11.13 $5.27 0 1.68 6.60%
TEVA Teva Pharma. $51.89 14.16 $3.66 1.70% 2.13 10.43%
ATVI Activision Blizzard, Inc $11.07 33.55 $0.33 1.50% 1.3 10.81%
CELG Celgene Corp. $53.47 28.44 $1.88 0 4.79 11.35%
EXPE Expedia, Inc. $20.96 14.36 $1.46 1.30% 2.15 14.54%
MSFT Microsoft Corp. $27.06 11.55 $2.34 2.40% 4.72 19.05%
MICC Millicom Intl. Cellular $90.27 5.92 $15.24 2.60% 3.06 19.86%

Watch List Performance Review

In our ongoing review of the Nasdaq 100 Watch List, we have taken the stocks from our list of February 21, 2010 (article here) and have checked their performance one year later. The companies on that list are provided below with the closing price for February 19, 2010 and February 18, 2011. 
Four of the companies on our list managed to exceed the Nasdaq 100 while the other four on the list underperformed the index.  Stericycle (SRCL) was the biggest winner with a 60.92% gain.  Gilead Sciences (GILD) was the biggest loser over the last year with a decline of -19.53%.
Symbol Name 2010 2011 Change
APOL Apollo Group $56.92 $45.82 -19.50%
ERTS Electronic Arts $16.75 $19.28 15.10%
FSLR First Solar $116.00 $168.22 45.02%
ATVI Activision $10.79 $11.07 2.59%
PPDI Pharma Prod. $21.20 $27.97 31.93%
SRCL Stericycle $54.30 $87.38 60.92%
GENZ Genzyme $55.97 $75.38 34.68%
GILD Gilead $48.84 $39.30 -19.53%
Average 18.90%
NDX Nasdaq 100 1823.32 2392.47 31.22%
Please revisit New Low Observer for edits and revisions to this post. Email us.