Category Archives: Uncategorized

NLO Dividend Watch List: August 6, 2011

Quick Take: U.S. rating downgrade
Late Friday evening, Standard & Poor's downgraded the debt of the U.S. from AAA to AA+.  The full implications of such action are yet to be known.  However, we believe that there are some interesting points to be made.  A lower debt rating will require the U.S. government to increase the yield offered on new issuance's. A more competitive yield might draw money out of the stock market and into fixed income securities. As rates rise, utilities and real estate investment trusts (REITs) might come under extreme pressure as the markets try to weight the benefit of holding assets that offer no guarantee and relatively less competitive yields.
Also, it has not gone unnoticed by us that the U.S. first got tagged with the AAA rating in 1941 and had held that rating through a completed interest rate cycle.  It seems almost ironic that the AAA rating ascribed to the U.S. when interest rates were at their lowest would be taken away at the same level 70 years later.  We also note that rating agencies tend to show up late to the party.  The chart below tells us that it only gets interesting from here.
  
NLO Dividend Watch List
At the end of the week, our list contained over 120 companies. We had to pare down the number of companies on the list so we decided to post only those stocks trading within 5% of the 52-week low.
symbol name price p/e earnings yield p/b % from low
GBCI Glacier Bancorp, Inc. 12.41 21.66 0.59 3.9 1.05 0.08%
SYBT S.Y. Bancorp, Inc. 21.47 12.41 1.71 3 1.72 0.28%
BOH Bank of Hawaii 43.04 12.77 3.37 4 2.03 0.49%
O Realty Income 30.01 28.5 1.04 5 2.21 0.81%
SFNC Simmons First National 23.47 11.29 2.15 3 1.03 0.95%
FNFG First Niagara Financial 11.06 16.58 0.76 5 0.79 1.10%
CHFC Chemical Financial 18.05 13.52 1.34 4.2 0.88 1.12%
MLM Martin Marietta 67.63 36.76 2.24 2 2.16 1.17%
SUSQ Susquehanna Bancshares 6.8 39.53 0.17 1 0.45 1.19%
CFR Cullen/Frost Bankers 51.28 14.53 3.5 3.4 1.46 1.24%
PRK Park National 60 13.52 4.51 5.8 1.42 1.52%
TCB TCF Financial 11.83 13.77 0.99 1.5 1.07 1.55%
SON Sonoco Products 29.9 15.03 2.04 3.5 1.91 1.63%
CMA Comerica 29.13 14.98 1.68 1.2 0.88 1.75%
IBKC IBERIABANK 49.18 28.84 1.84 2.3 1 1.80%
ALL Allstate 26.29 25.06 2.45 3 0.72 1.94%
EMR Emerson Electric 45.39 13.99 3.11 2.5 3.15 1.95%
BRK-A Berkshire Hathaway 107k 16.3 6.6k - 1.1 1.98%
MCY Mercury General 36.54 13.43 2.72 6.2 1.11 2.07%
MDP Meredith 26.56 9.56 2.85 3.4 1.58 2.08%
NTRS Northern Trust 41.3 16.39 2.71 2.4 1.41 2.13%
FII Federated Investors 19.53 12.14 1.67 4.3 3.75 2.20%
GS Goldman Sachs 125.18 12.28 9.13 1 0.94 2.31%
HGIC Harleysville 29.5 10.56 2.79 4.7 1.03 2.36%
SEIC SEI Investments 17.76 14.56 1.22 1.2 3.11 2.36%
AFL AFLAC 41.72 10.97 4.44 2.7 1.65 2.38%
PG Procter & Gamble 60.59 15.97 3.8 3.3 2.53 2.40%
BKH Black Hills 28.8 17.61 1.64 4.8 1 2.42%
LEG Leggett & Platt 19.3 16.31 1.16 4.6 1.88 2.50%
CINF Cincinnati Financial 25.97 14.36 2.27 5.8 0.84 2.53%
WMT Wal-Mart Stores 50.85 11.11 4.58 2.7 2.68 2.54%
AVY Avery Dennison 29.12 10.47 2.88 3.2 1.72 2.57%
UBSI United Bankshares, Inc. 22.66 13.73 1.66 4.8 1.24 2.58%
ANAT American Nat'l Insurance 76.02 12.85 5.91 4.1 0.55 2.59%
WEYS Weyco Group, Inc. 22.83 19.85 1.15 2.5 1.48 2.61%
NWN Northwest Natural Gas 42.8 16.31 2.62 3.7 1.58 2.64%
AVP Avon Products 23.21 13.56 1.62 3.3 4.87 2.72%
TDS TDS 25.47 19.59 1.3 1.6 0.7 2.83%
RBCAA Republic Bancorp 17.29 3.95 4.36 2.9 0.83 2.86%
CYN City National 48.58 16.09 3.02 1.5 1.27 2.95%
BXS BancorpSouth 11.92 25.36 0.16 0.3 0.83 3.03%
LLTC Linear Technology 27.08 10.83 2.36 3.1 12.52 3.08%
MRK Merck & Company 31.71 59.94 0.53 4.2 1.79 3.12%
EV Eaton Vance 23.29 15.12 1.54 2.5 5.71 3.14%
TRH Transatlantic Holdings 45.24 17.2 3.06 1.7 0.69 3.17%
TEG Integrys Energy Group 47.58 12.67 3.75 5.2 1.23 3.19%
NUE Nucor 34.95 23.6 0.82 3.6 1.48 3.22%
SCG SCANA Corp 37.32 12.56 2.97 4.7 1.24 3.38%
VLY Valley National Bancorp 12.15 14.45 0.77 5 1.6 3.47%
VNO Vornado Realty Trust 80.78 18.75 4.31 2.8 2.61 3.48%
ADM Archer-Daniels-Midland 28.64 9.15 3.25 2.1 0.97 3.58%
FCBC First Community Banc 12.04 9.48 1.25 2.7 0.76 3.70%
ECL Ecolab Inc. 47.78 21.51 2.23 1.4 4.77 3.71%
UVV Universal 36.33 6.7 5.42 5.1 0.84 3.74%
VAL Valspar 30.17 13.94 2.16 2.1 1.82 3.78%
BMI Badger Meter 35.27 20.04 1.76 1.5 3.01 3.80%
GCI Gannett Co. 10.8 5.07 2.13 2.3 1.19 3.85%
LOW Lowe's 20.15 14.18 1.42 2.4 1.53 4.13%
PEP Pepsico 64.67 16.45 3.74 3.1 4.17 4.22%
SJW SJW 22.86 17.2 1.28 2.8 1.67 4.48%
MUR Murphy Oil 55.2 11.64 4.74 1.6 1.29 4.55%
FFIN First Financial 30.44 14.79 1.99 2.8 2 4.85%
KMB Kimberly-Clark 64.07 15.12 4.4 4.1 4.22 4.93%
Top 5 Performance review
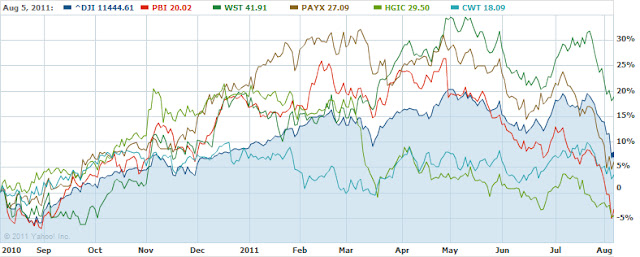
In our ongoing review of the NLO Dividend Watch List, we have taken the top five stocks on our list from August 6, 2010 and have check their performance one year later. The top five companies on that list can be seen in the table below.
Symbol Company 2010 2011 % change
PBI Pitney Bowes Inc   20.71 20.02 -3.33%
WST West Pharmaceutical Services 35.26 41.91 18.86%
PAYX Paychex, Inc.  25.56 27.09 5.99%
HGIC Harleysville Group 30.9 29.5 -4.53%
CWT California Water Service Group 17.49 18.09 3.43%
Average 4.08%
^DJI Dow Industrials 10653.56 11444.61 7.43%
^GSPC S&P 500 1121.64 1199.39 6.93%
The top 5 companies on our list last year underperformed the major indexes by a wide margin.  However, in the chart below, you'll notice that all 5 stocks achieved 10% gains (our ideal target for selling) within 4 months of the August 6th posting; such a gain approximates nearly 30% annualized returns.  We cannot emphasis enough the value of selling these stocks if a 10% gain is accomplished within a year while inside of a tax-deferred account.  As you can see, the year end results vastly differ from the gains that could have been made.
Please consider donating to the New Low Observer. Thank you.

Nasdaq 100 Watch List: July 29, 2011

Below are the Nasdaq 100 companies that are within 20% of the 52-week low. This list is strictly for the purpose of researching whether or not the companies have viable business models. Although these companies are very risky, based on the current price they are at reasonable values and offer significant opportunity to outperform the market in the coming year.
Symbol Name Price P/E EPS Yield P/B % from Low
RIMM Research In Motion 25 3.97 6.3 0.00% 1.38 0.77%
YHOO Yahoo! Inc. 13.1 14.79 0.89 0.00% 1.38 1.24%
QGEN Qiagen N.V. 16.94 29.21 0.58 0.00% 1.57 2.17%
AKAM Akamai Technologies 24.22 25.63 0.95 0.00% 2.02 2.45%
LLTC Linear Technology 29.3 12.42 2.36 3.20% 17.06 2.99%
TEVA Teva Pharmaceutical 46.64 12.54 3.72 1.70% 1.8 3.97%
FSLR First Solar, Inc. 118.23 16.87 7.01 0.00% 2.84 6.13%
LIFE Life Technologies 45.03 22.45 2.01 0.00% 1.87 6.20%
PCAR PACCAR Inc. 42.81 21.73 1.97 1.70% 2.67 7.64%
CSCO Cisco Systems, Inc. 15.97 12.47 1.28 1.50% 1.87 8.05%
AMGN Amgen Inc. 54.7 11.37 4.81 0.00% 2 8.83%
ADBE Adobe Systems 27.71 14.84 1.87 0.00% 2.57 8.88%
SPLS Staples, Inc. 16.06 13.05 1.23 2.50% 1.57 8.88%
INFY Infosys Limited 62.22 22.88 2.72 1.40% 5.69 9.68%
WCRX Warner Chilcott plc 21.02 32.9 0.64 0.00% N/A 10.57%
VRSN VeriSign, Inc. 31.21 6.66 4.69 0.00% 9.89 12.27%
MRVL Marvell Technology Group, Ltd. 14.82 11.73 1.26 0.00% 1.87 12.53%
CHRW C.H. Robinson Worldwide, Inc. 72.31 28.92 2.5 1.60% 9.29 13.34%
ATVI Activision Blizzard, Inc 11.84 27.41 0.43 1.40% 1.34 13.85%
FLIR FLIR Systems, Inc. 27.46 20.95 1.31 0.90% 2.72 14.42%
PAYX Paychex, Inc. 28.23 19.88 1.42 4.40% 6.86 14.52%
LRCX Lam Research Corporation 40.88 6.96 5.88 0.00% 2.28 15.51%
MU Micron Technology, Inc. 7.37 11.66 0.63 0.00% 0.87 15.88%
SHLD Sears Holdings 69.67 N/A -0.49 0.00% 0.91 15.88%
URBN Urban Outfitters, Inc. 32.54 21.32 1.53 0.00% 3.96 16.38%
FFIV F5 Networks, Inc. 93.48 34.38 2.72 0.00% 6.53 16.85%
MSFT Microsoft Corporation 27.4 10.19 2.69 2.30% 4.07 17.50%
NIHD NII Holdings, Inc. 42.35 18.76 2.26 0.00% 2.04 19.13%
AMAT Applied Materials, Inc. 12.32 10.36 1.19 2.60% 2.01 19.96%

Watch List Performance Review

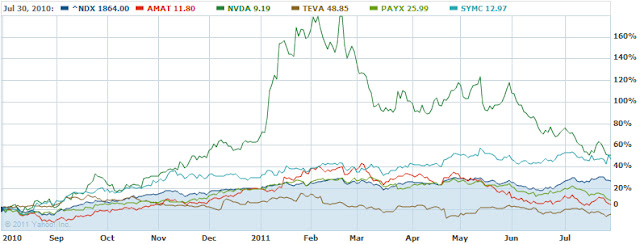
In our ongoing review of the Nasdaq 100 Watch List, we have taken the top five stocks on our list from July 30, 2010 and have checked their performance one year later. The top five companies on that list can be seen in the table below.
Symbol Name 2010 2011
% change
SYMC Symantec Corp. 12.97 19.06
46.95%
AMAT Applied Materials 11.80 12.32
4.41%
NVDA NVIDIA Corp. 9.19 13.83
50.49%
TEVA Teva Pharma. 48.85 46.64
-4.52%
PAYX Paychex, Inc. 25.99 28.23
8.62%
Average gain
21.19%
^NDX Nasdaq 100 1864.00 2362.81
26.76%
Please consider donating to the New Low Observer. Thank you.

In the News

Please consider donating to the New Low Observer. Thank you.

Dow Theory Misunderstood

Recently, in an article titled “Sell Signal for Stocks” found in Barron’s, Michael Kahn covers the topic of Dow Theory. The subtitle to the article was “a big drop in the transportation sector killed hope for a Dow Theory buy signal.” To the untrained reader of Dow Theory, Kahn’s article seems harmless enough. However, there are significant issues that need to be reconciled before it can be considered a discussion of Dow Theory.
Getting down to business, there are a couple of items that have to be addressed starting with the subtitle. First is the part that says “a big drop in the transportation sector killed hope for a Dow Theory buy signal.” If you’re someone who wishes to practice Dow Theory, you must abandon all hope, literally. William Peter Hamilton once said:
The averages, indeed, must be read with a single heart. They become deceptive if and when the wish is father to the thought”[1].
For Mr. Kahn to imply that hope has a role in a Dow Theorist’s mind when a buy signal is registered suggests that Mr. Kahn doesn’t understand Dow Theory. The study of the market using Dow Theory is best done when hopes and fears are abandoned.
The second item of concern in the subtitle relates to the indication of a buy signal. Dow Theory isn’t a “beat the market” strategy or get rich scheme. Dow Theory is as much an indicator of future economic growth for our country as it is a barometer for the stock market. William Peter Hamilton shed light on this topic by saying:
Diligent study of the averages will sufficiently show where a ‘line,’ having proved to be one of accumulation, has given definite information, not merely useful to the trader but valuable to those who look upon the stock market as a means of forecasting the trend of the country's general business”[2].
Also, Dow Theory does not give buy or sell signals. As a barometer, it merely indicates the direction that the stock market and economy might go three to nine months into the future. Those who take bull market indications as buy signals still need to be well versed in understanding values and its role in the selection of stocks. If a person not versed in values believes that a bull market indication means that they can haphazardly buy stocks then they are most likely to suffer severe losses and quickly become disenchanted with investing in stocks.
Throughout Kahn’s stab at Dow Theory, statements like “…good times turn to bad…” and “…followers of the century-old Dow Theory suddenly got excited” or “…followers were eagerly awaiting…” suggests that a person who uses Dow theory is emotionally tied to the outcome. Charles H. Dow was about as unemotional on the markets as anyone could get. William Peter Hamilton couldn’t become editor of the Wall Street Journal until after Dow’s death because Dow thought that Hamilton was too emotionally tied to his work. A person who is involved with Dow Theory needs to check their emotions at the door. Mr. Kahn seems to not take this into consideration when he wrote his article. If anything, Mr. Kahn should only be following Dow Theorists who reflect the most balanced view on the market’s direction, either up or down.
Specific to Dow Theory, Kahn says something that jumps off the page. In the fourth paragraph, Kahn states, “The bears have apparently resumed control of the stock market…” Kahn arrives at this conclusion based solely on the fact that the Dow Jones Transportation Index has declined. In Dow Theory, there is no such reference to the idea that simply because a single index declines from a peak that a bear market has been registered or that “the bears have resumed control of the stock market…” At no point does Kahn reference the fact that the prior trend (bullish) is presumed to be in force until specific conditions are met. Hamilton says as much in the following remark:
Perhaps it might be permissible to say that the secondary [reaction] movement suspends for a time the great primary swing, although a natural law is still in force even when we counteract it”[3].
Richard Russell adds clarity to Hamilton’s comments by saying the following:
… in examining the action of the Averages over a period of sixty-five years, the Dow Theorist has learned, among other things, that the movement of a single Average should never be considered alone. Further, the Dow Theorist has learned that the last trend should be considered to remain in effect until the contrary has been proved”[4].
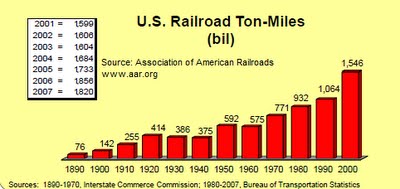
In the sixth paragraph, Kahn suggests that because the composition of the Dow Jones Industrial Index has changed dramatically over the years that we could hardly expect it to be a true reflection of our economy. Kahn implies that because we’re in a services and information-based economy, that there is less transporting of products by rails and trucks and therefore can’t possibly be reflective of the times. The charts below reflecting only the rail sector tells a completely different story.
For 2007, more revenue was generated through rail transportation than any other method of domestic transportation. Not far behind rail was trucking, which, when combined, equaled nearly 74% of total revenue generated for all methods of transportation within the U.S.
In paragraph 7, Kahn succumbs to a common myth about the relationship between commodity prices and the level of the stock market. Kahn suggests that when commodity prices are down then the stock market has every reason to rise because commodities “…are input costs for many large-cap U.S. companies…” Certainly commodities are input costs for most production but there is little to suggest that there is an inverse relationship between the two other than the ebb and flow of bad U.S. monetary policy. As a Dow Theorist, Kahn should know that Charles H. Dow said in his Wall Street Journal column on February 21, 1901:
…the stock market and the commodity market move substantially together” [5].
We have been able to confirm the relationship between commodity prices and the stock market with gold, silver and various commodity processing companies like ConAgra (CAG), Heinz (HNZ), Archers Daniels-Midland (ADM) and Sysco Foods (SYY). Kahn is right about the input costs but wrong about the inverse relationship between the stock market and commodities.
Starting in paragraph 9, Kahn begins to provide technical analysis of the iShares Dow Jones Transportation ETF. Use of an ETF to derive inference of the Dow Jones Transportation Average when the data on the index is freely available comes off as lazy. In the end, the ETF cannot show you what the Dow Jones Transportation Average did in 1946 or 1973 which is important because inevitably you’re going to need that data. If Kahn was going to use the Tranports ETF, he should have shown the 100% correlation to the actual index to justify using the ETF. No such evidence was presented for using the ETF over the actual index.
In the review of the transport ETF, Kahn speaks at length on chart patterns known as gaps and gap reversals. Considerable effort is put into explaining how the gap reversal pattern reflects negatively on the direction of the transport ETF. However, noticeably absent in his discussion of the transport ETF is the obvious “double top” formation. Double tops and double bottoms were indicated to be very important formations according to Charles H. Dow. Alternatively, William Peter Hamilton and Robert Rhea arrived at the conclusion that such formations bear little importance when considering the price movement of the indexes. From our own work on the topic of double tops and double bottoms, we have found that Dow was right about the importance of such a price characteristic and have been able to prove, with significant evidence throughout the history of the Dow indexes, that double tops and double bottoms are critical indicators for determining market direction when applying Dow Theory.
After the discussion of the transports ETF, Kahn goes far afield when he starts to discuss the price action of several illiquid sector specific ETFs from within the transportation industry. Kahn covers the airline and shipping as representative examples of the malaise that he believes reflects the weakness in the transportation sector of the economy. Both the airline and shipping ETFs are reaching new 52-week lows (our favorite point to examine values.) However, such analysis doesn’t seem to add up when compared to the iShares Dow Jones Transportation ETF.
If the Dow Transportation ETF is just coming off of a new high, then what relevance does the airline and shipping ETFs have to do with the discussion of the broader index which contains shipping, rail and airline stocks? From a Dow Theory perspective, such maneuvering to prove a point is in contravention of the theory itself. According to Dow, Hamilton, Rhea and a host of others, though not infallible, the averages discount everything.
Kahn finishes his article by saying that if the Dow Jones Transportation Average (notice the switch to index from the ETF) cannot hold above the March low of 4920 then a sell signal would have been registered. Dow Theory just doesn’t work this way. The theory is all about confirmations. As Hamilton says:
One of the shortest ways of going wrong is to accept an indication by one average which has not been clearly confirmed by the other. [6]”
If the Transportation Average breaks the March low then the only way to get a sell signal is to have the Industrial Average break the March low. For all intents and purposes, the Transportation Average could fall to 3000 or lower without triggering a sell signal. Historically speaking, such a wide divergence on a relative basis has occurred before without triggering a sell signal.
We understand that Kahn is the big money man who can articulate his thoughts in a fashion that is acceptable to publications like Barron’s. However, we know that his interpretation of Dow Theory is incorrect.
Citations:
[1] Hamilton, William Peter. The Stock Market Barometer. Harper & Brothers, New York. 1922. page 133.
[2] ibid. page 177.
[3] ibid. page 154.
[4] Russell, Richard. Richard Russell’s Dow Theory Letters. Issue 166. December 27, 1961. page 1.
[5] Sether, Laura. Dow Theory Unplugged. W&A Publishing. 2009. page 50.
[6] Hamilton, William Peter. The Stock Market Barometer. Harper & Brothers, New York. 1922. page 138.


Please consider donating to the New Low Observer. Thank you.

In the News: July 18, 2011

Please consider donating to the New Low Observer. Thank you.

Nasdaq 100 Watch List: July 15, 2011

Below are the Nasdaq 100 companies that are within 20% of the 52-week low. This list is strictly for the purpose of researching whether or not the companies have viable business models. Although these companies are very risky, based on the current price they are at reasonable values and offer significant opportunity to outperform the market in the coming year.
Symbol Name Trade P/E EPS Yield P/B % from low
CSCO Cisco Systems, Inc. 15.59 12.17 1.28 1.50% 1.8 3.23%
AKAM Akamai Technologies 29.85 31.59 0.95 0 2.51 5.48%
SPLS Staples, Inc. 15.2 12.35 1.23 2.60% 1.49 6.11%
TEVA Teva Pharmaceutical 47.97 12.9 3.72 1.70% 1.87 6.93%
MRVL Marvell Technology 14.87 11.77 1.26 0 1.83 7.21%
URBN Urban Outfitters, Inc. 31.41 20.58 1.53 0 3.81 8.20%
QGEN Qiagen N.V. 18.28 31.52 0.58 0 1.68 8.42%
AMGN Amgen Inc. 55.05 11.44 4.81 0 2.08 9.53%
INFY Infosys Limited 61.39 22.57 2.72 1.40% 5.63 9.74%
BRCM Broadcom Corp 33.27 16.79 1.98 1.10% 3.06 11.27%
YHOO Yahoo! Inc. 14.69 17.26 0.85 0 1.49 13.52%
CERN Cerner Corporation 61.9 42.11 1.47 0 5.14 14.09%
ADBE Adobe Systems 29.29 15.69 1.87 0 2.69 15.09%
ATVI Activision Blizzard 11.91 27.57 0.43 1.40% 1.33 15.41%
LLTC Linear Technology 30.48 12.92 2.36 3.10% 17.46 16.11%
MU Micron Technology 7.41 11.72 0.63 0 0.85 16.51%
MSFT Microsoft Corp 26.78 10.64 2.52 2.40% 4.18 17.82%
LRCX Lam Research 42.06 7.16 5.88 0 2.23 18.85%
Watch List Summary
Sirius XM gets added to Index
On Monday July 11, 2011, Sirius XM Radio (SIRI) was added to the Nasdaq 100 index. The addition of Sirius defies logic unless there is something about the future prospects for SIRI that the Nasdaq committee knows that we don’t. Typical of many index selection committees, SIRI is being added near its 2 ½-year high as opposed to being added when the stock is near the 52-week low.
Although a low priced stock, Sirius XM (SIRI) is not inexpensive. SIRI currently sports a trailing p/e ratio of 221 but is estimated to have a forward (2012) p/e ratio of 31. There are two ways that this scenario can play out, either the stock price will fall to $0.31 or the earnings will rise from $0.01 to $0.07.
We’re willing to submit to the idea that somewhere in between lays the truth. For example, if earnings rise to $0.04 a share and the p/e multiple comes down to 100 by year end 2012, then the stock would be conservatively price at around $4 a share. However, this is among the rosiest scenarios that could be depicted for this stock at the moment.
SIRI is a speculator’s dream, but it presently relies on the greater fool theory to justify rising another 150% as it had in the last 12 months. Speculators will be richly rewarded for taking unmitigated risk by going long SIRI if earnings doubled or triple. However, with the p/e ratio at 221, nothing less than perfection is expected from SIRI.
Being added to the Nasdaq 100 gives a lifeline that didn’t seem to exist for Sirius (SIRI). With the wind at its back, the odds increase that the SIRI can perform as some bulls expect. However, going into the fourth quarter of the year, if the stock does not perform as planned then Sirius will be summarily dismissed from the index as quickly as it was added.  However, as we said before, maybe the Nasdaq committee knows something we don't which justifies Sirius being added to the index as opposed to the other 49 companies on their list of eligible candidates.
Nasdaq Fritters Away Significant Opportunity
We’re surprise that, out of the 50 alternatives to add to the Nasdaq 100 index, Sirius XM Radio (SIRI) was the prime choice. After all, if a company with an $8 billion market cap, $0.01 of earnings and 221 p/e ratio was all that could be found then something must be awry with the Nasdaq selection committee. In the table below, we found four companies that are among the 50 on the list of companies that should have been selected instead of SIRI.
Our suspicion is that SIRI has been added to the index simply as a means to have a position that rivals the recent IPO of Pandora (P). This will certainly give SIRI a boost but if the post-IPO performance of Pandora (P) is any indication, SIRI gains could become the Nasdaq 100’s pains.
A simple question should be asked, “do you see Sirius XM Radio (SIRI) as the best investment alternative when most major indexes have been in a 2-year cyclical bull market?” Adding Sirius XM Radio (SIRI) to the Nasdaq 100 index under the current conditions reflect a lapse in judgment.
Chip Sector Dip
On July 12, 2011, Microchip Technology (MCHP) fell 12% on news that prospects for the future weren’t as bright as analysts anticipated. The Wall Street Journal seemed to believe that MCHP’s decline was the “…canary in the [chip]sector’s coalmine.” The decline in MCHP has resulted in 4.19% dividend yield.
The last time that we wrote about MCHP, March 20, 2010, the company was yielding 4.80%. At the time we said of the chip sector, “[the] clustering of companies in a specific industry may indicate that the entire sector is undervalued.” Several articles we wrote about the chip sector in March 2010 followed with a particular article of interest on the topic titled “Applied Materials and the Chip Sector Should Be on Your Radar.”
To varying degrees, our assessment was correct. At the 1-year marker after the list of chip stocks was generated, only one stock Intel (INTC) was unable to provide above average returns. All other chip stocks on our March 20th list generated a minimum of 26% as indicated in the chart below. In general, March of 2011 has marked the top on the chip stocks mentioned so far with Microchip Technology (MCHP) and Applied Materials giving back the most from their respective price peak.
Despite the large declines by MCHP, the total return for MCHP has been 20.67% as opposed to the unadjusted return of 11.25%. In the case if Microchip Technology, the total return had been 54.85% at the most recent high set on May 12, 2011.  Microchip Technology (MCHP) and many of its competitors aren’t out of the woods yet. However, as the dividend yields increase, there becomes little justification for ignoring these stocks.
Google Jumps On Usual Earnings Surprise
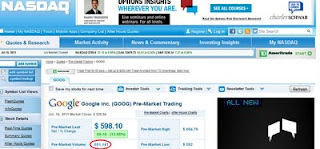
On Friday July 15, 2011, Google’s (GOOG) announcement of 36% profit growth resulted in 13% gain in pre-market trading. As we’ve demonstrated before, pre-market trading rules the rest of the trading day. According to the Nasdaq.com website, 651,141 shares traded in the pre-market and Google rose 13.08% or $69.16.
During the regular market hours on the same day, 13 million shares changed hands with the stock declining $-0.48. We’d view the inability of the stock to move higher during regular market hours on tremendous volume as an overall negative.
According to S.A. Nelson, the man credited with coining the term “Dow Theory”, “…stocks have recovered after artificial depression and relapsed after artificial advances to the middle point which represented value as it was understood by those who bought or held as investors." Based on the chart pattern below, it appears that Google’s stock price is bumping up against the artificial advance or overvalued range. Since early 2008, Google (GOOG) has had challenges advancing far above the $630 level. The most recent move should provide more clarity on whether GOOG can make a strike for the $715 level.
Google (GOOG) was last on our watch list on June 17, 2011. At that time, GOOG was selling for $500 with a p/e ratio of 19 and a p/b ratio of 3. So far, the stock has risen 19% in exactly one month. From our perspective, there is little need to tempt a stock price that, although it can move higher, has already provided greater than 200% on an annualized basis.
Watch List Performance Review
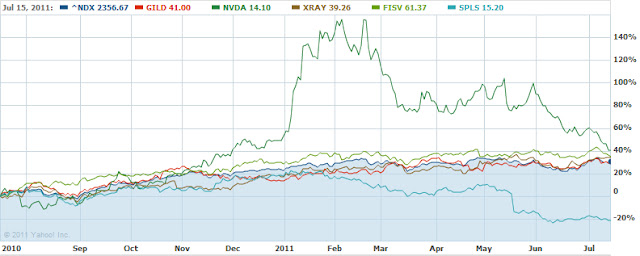
In our ongoing review of the Nasdaq 100 Watch List, we have taken the top five stocks on our list from July 17, 2010 and have checked their performance one year later. The top five companies on that list can be seen in the table below.
Symbol Company 2010 2011 % change
GILD Gilead Sciences $31.94 $41.00 28.37%
NVDA NVIDIA $10.05 $14.10 40.30%
XRAY DENTSPLY $29.25 $39.26 34.22%
FISV Fiserv, Inc. $45.60 $61.37 34.58%
SPLS Staples, Inc. $19.31 $15.20 -21.28%
- - - - -
- - - Average 23.24%
- - - - -
NDX Nasdaq 100 1803.48 2356.67 30.67%
In the last year there were two outliers when compared to the Nasdaq 100 Index.  First was Nvidia (NVDA) which soared as high as 150% in the first six months of being on our July 15, 2010 list.  On the other end of the spectrum we have Staples (SPLS) which has languished with loses of more than -20% in the last year.  Overall, the top five stocks on our watch list from last year underperformed the corresponding index by -7.43%.  Only three of the stocks (XRAY), (FISV) and (NVDA) were able to exceed the returns of the Nadaq 100.  The 28% return from (GILD) and -20% from (SPLS) dragged the performance of the top 5 down considerably.
Disclaimer:

On our current list, we excluded companies that have no earnings. Stocks that appear on our watch lists are not recommendations to buy. Instead, they are the starting point for doing your research and determining the best company to buy. Ideally, a stock that is purchased from this list is done after a considerable decline in the price and extensive due diligence. We suggest that readers use the March 2009 low (or the companies' most distressed level in the last 2 years) as the downside projection for investing. Our view is to embrace the worse case scenario prior to investing. A minimum of 50% decline or the November 2008 to March 2009 low, whichever is lower, would fit that description. It is important to place these companies on your own watch list so that when the opportunity arises, you can purchase them with a greater margin of safety. It is our expectation that, at the most, only 1/3 of the companies that are part of our list will outperform the market over a one-year period.

Please consider donating to the New Low Observer. Thank you.

Nasdaq 100 Watch List

Below are the top Nasdaq 100 companies that are within 20% of the 52-week low. This list is strictly for the purpose of researching whether or not the companies have viable business models. These companies are deemed highly speculative unless otherwise noted.
Symbol Name Trade P/E EPS Yield P/B % from Low
CEPH Cephalon, Inc. 59.64 11.14 5.35 N/A 1.81 8.44%
CSCO Cisco Systems, Inc. 20.73 15.13 1.37 N/A 2.59 9.08%
QGEN Qiagen N.V. 18.56 29.18 0.64 N/A 1.8 10.08%
TEVA Teva Pharmaceutical 52.86 16.27 3.25 1.30% 2.23 12.49%
ATVI Activision Blizzard, Inc 11.25 38.25 0.29 1.30% 1.29 13.24%
AMGN Amgen Inc. 56.97 12.31 4.63 N/A 2.27 13.35%
CELG Celgene Corporation 56.03 28.3 1.98 N/A 5.06 16.68%
GRMN Garmin Ltd. 30.79 8.42 3.66 4.90% 2.11 17.92%
INTC Intel Corporation 20.82 10.16 2.05 3.00% 2.34 18.30%
DELL Dell Inc. 13.47 12.95 1.04 N/A 3.85 18.78%

Watch List Performance Review

In our ongoing review of the Nasdaq 100 Watch List, we have taken the top five stocks on our list from the closing price of January 22, 2010 and have checked their performance one year later.  The top five companies on that list are provided below with the closing price for January 22, 2010 and January 21, 2011.

Symbol
Company
2010
2011
% change
First Solar
112.39
147.41
31.16%
Gilead Sci.
46.08
38.19
-17.12%
Genzyme
54.38
71.58
31.63%
Apollo Grp
61.19
42.35
-30.79%
Electronic Arts
16.77
15.13
-9.78%
Average Gain
1.02%
NDX
Nasdaq 100
1794.82
2268.32
26.38%

Disclaimer

Stocks that appear on our watch lists are not recommendations to buy. Instead, they are the starting point for doing your research and determining the best company to buy. Ideally, a stock that is purchased from this list is done after a considerable decline in the price and extensive due diligence. We suggest that readers use the March 2009 low (or the companies' most distressed level in the last 2 years) as the downside projection for investing. Our view is to embrace the worse case scenario prior to investing. A minimum of 50% decline or the November 2008 to March 2009 low, whichever is lower, would fit that description. It is important to place these companies on your own watch list so that when the opportunity arises, you can purchase them with a greater margin of safety. It is our expectation that, at the most, only 1/3 of the companies that are part of our list will outperform the market over a one-year period.

Quote of the Day

The following is the conclusion from the Examiner's report on the failure of Lehman Brothers. This full report is a must read for anyone interested in the use of GAAP acounting and its acceptability despite being illegal at times.   The full report is available here.  

"After reaching the tentative conclusion that claims existed against Fuld, O’Meara, Callan, Lowitt, and Ernst & Young, the Examiner reached out to counsel for each, advised them of the basis for the potential finding, and invited each of them to present any additional facts or materials that might bear on the final conclusion. All counsel accepted the Examiner’s offer. In the weeks leading up to the submission of this Report, the Examiner had individual, face to face meetings with counsel for Fuld, O’Meara, Callan, Lowitt, and Ernst & Young, and carefully considered the materials raised by each. While there were credible facts and arguments presented by each that may form the basis for a successful defense, the Examiner concluded that these possible defenses do not change the now final conclusion that there is sufficient evidence to support a finding that claims of breach of fiduciary duty exist against Fuld, O’Meara, Callan, and Lowitt and a colorable claim of professional malpractice exists against Ernst & Young."

Lehman Report
REPORT OF ANTON R. VALUKAS, EXAMINER
VOLUME 3 OF 9 Section III.A.4: Repo 105 Page 990.
Jenner and Block
http://www.jenner.com/

Email our team here.

A Simple Way to Avoid Losing Money in Stocks

One of the easiest and most sure-fire ways to avoid losing money in stocks is to assume that every investment at some point will lose 50% or more. From this standpoint, all investments will be the most judicious and thoughtful. Transaction will not be entered into lightly.

Throughout my writing on the topic of investing, I have repeatedly stated that I always factor in losing 50% before buying a stock. Some readers have asked me, “Why in the world would you invest in something that you think could decline in value by 50%?” My response is always the same, if you haven’t accounted for the worst-case scenario then you aren’t really investing, instead you’re gambling.

I have found that by accounting for the downside risk of 50%, my mind is capable of assessing market declines with a more objective approach. Additionally, I am able to sleep soundly at night.

Below is a transcription of a BBC News interview of Charlie Munger who addresses the idea of accepting 50% loss in Berkshire Hathaway.

BBC News: How worried are you by the share price decline of Berkshire Hathaway?

Munger: Zero. This is the third time that Warren and I have seen our holdings in Berkshire go down, top tick to bottom tick, by 50%. I think it’s in the nature of long term shareholding with the normal vicissitudes and worldly outcomes and in markets, that the long term holder has his quoted value of his stock go down and then by say 50%. I think you can argue that if you’re not willing to react with equanimity to a market price decline of 50% two or three times a century you’re not fit to be a common shareholder and you deserve the mediocre result you’re going to get, compared to the people who do have the temperament who can be more philosophical about these market fluctuations.

It should be noticed that Munger mentions that he has experienced 3 instances of 50% declines in Berkshire Hathaway in the 42 years of its existence. This means that, on average, a portfolio is going to take a massive hit every 14 years or so. This assumes that you have the investment acumen of Warren Buffett and Charlie Munger. If you don’t have the investment savvy of Buffett and Munger, then the likelihood of losing 50% in your portfolio increases significantly.Now you know how easy it is to adhere to Warren Buffett’s rule number one, “don’t lose money.” After all, if you expect that your investments will lose 50% then you really start losing at 51%. Just be sure that you have the right strategy before you buy.

  • Before entering into a trade or investment, ask yourself if you’re willing to lose 50% or more.

For Traders or Investors Alike: 3 Steps to Investment Success

The secret to stock market investing is that there is no secret. First, you need to find stocks that represent quality companies. Quality companies are those that can compensate you for the period between the time that you buy and the time that you sell. While there are many companies that pay a dividend there are only a few that have been able to increase their dividend through good times and bad. Our focus on Dividend Achievers allows us to concentrate on quality regardless of stock market gyrations.
In our focus on dividends, we have found that the use of company numbers can be manipulated while the dividend payment is either paid or not paid. Of all the financial fraud that has ever existed in the corporate world, I have never known of a revision or recall of dividend payments. The dividend history is the only measure that doesn't lie.
Second, in order to buy low and sell high, an investor needs to focus only on those quality companies that have reached a new one year low in their price. This does not mean that the stock should be bought at the new low. Instead, the investor should determine the viability of the organization as a going concern. Fundamental analysis is one approach that can be used to determine if other investors will realize that the company of interest is undervalued or underpriced. However, fundamental analysis alone should not be the measure to justify our purchase of any stock.
Third, the measure that should be used to determine if a stock should be bought is the amount that the investor is willing to lose given the worst case scenario. We always assume that We’re going to lose at least half of whatever we've invested. This way, we’re mentally prepared for the unexpected. In the best case scenario the stock goes nowhere, in which case we’re very satisfied collecting the dividend. If the stock goes up then we’re pleasantly surprised. If the stock goes down then we’re ready to do one of two things, sell or make the purchase of the second half of our investment cash. We usually hold no more than 5 stocks at a time and try to be 100% invested at all times. Also, we attempt to exceed a return greater than what could be obtained with "guaranteed" returns like treasuries, CDs and money market accounts.
The concepts that we have just outlined are backstop measures. This means that we have given ourselves a wide margin for error before we have committed the full amount of investable funds. This wide margin of error has turned out to be a considerable margin of safety at the same time based on my personal experiences of healthy gains during 2008. This method of investing has kept our money growing during periods that we didn't expect it to. Our success with this approach has been very much to our satisfaction.
I hope you are able to examine the premise of the over-simplified breakdown of our Dividend Achievers investment strategy. Hopefully you can benefit from some, if not all, of what we have learned. -Touc
  • Quality can be found in dividends, a history of increased dividends don't lie
  • Fundamental analysis is used to anticipate other investors reaction, not for the purpose of determining when to buy a stock
  • Since we're no Warren Buffett, we seek a wide margin for error not a wide margin of safety
  • More background on our investment strategy can be found at "About This Site."

Reinstating Glass-Steagall is a Fool’s Errand

In an effort to acquire political capital , Senator John McCain and Senator Maria Cantwell have proposed to reinstate the Glass-Steagall Act which was overturned by the signing of the Graham-Leach-Bliley Act by former President Bill Clinton in 1999. The belief is that, by bringing back the Glass-Steagall Act, all future financial instability will be banished somehow.

It should be remembered that before the passage of the Graham-Leach-Bliley Act, we had the debacle of the Savings and Loan (S&L) crisis. You'd think that with Glass-Steagall on the books, something like the S&L crisis would not have occurred. After all, S&Ls didn't have direct ties to investment banks and brokerage houses. Additionally, S&L regulators knew of the existence of Glass-Steagall. However, Glass-Steagall or not, when a mortgage crisis "happens" the impact on the economy is always devastating. In fact, the off budget costs of the S&L crisis still hasn't been paid for.

Maybe we could say that the S&L crisis occurred because of the accounting change required by FIRREA. Or perhaps the crisis happened because of the lax regulation by the Federal Savings and Loan Insurance Corporation (FSLIC). No matter, the crisis occurred despite all the regulatory agencies and requirements in place to avoid a crisis.

I'd love to use Japan as an example of the impact that a mortgage crisis has on an economy. However, some would argue that the crossholding of shares in banking and brokerage stocks led to a domino effect when the stock market collapsed. Others would argue that the Japanese have an opaque financial system that is run on close ties to the government and that that couldn't possibly happen here in the United States. Wait, that's exactly what happened here in the good ol' USA. Darn!!! That idea is out the window.

For some reason, I distinctly remember that Senator McCain was a "reluctant" participant in what was known as the Keating Five. McCain was the lone Republican Senator among four Democratic senators who acted on behalf of the failed Lincoln Savings and Loan chairman Charles Keating Jr. In his defense, McCain was later cleared of corruption charges but was criticized for using "poor judgment" in his relationship with Keating and Lincoln S&L. Although I'm all for learning from past failures, it seems odd that McCain would be leading the charge to go back to Glass-Steagall given his vote for the law that overturned the 1933 law (later revised in 1934.)

Just so you don't think that I'm Republican bashing, please read my article titled Autopsy of the Glass-Steagall Act. My distrust of politicians cuts right down the middle. After seeing where we've been, let alone where we are, I can't say that I'm impressed with either side of the same coin.

So why is the reinstating of Glass-Steagall such a fool's errand? Well, in order to understand the reasons why, you need to do a cursory review of the history of farming and securitization. Yes, my answer lies in a distinct understanding of how farms and securitization, err, don't really work well together.

You see, financial markets are replete with financial panics in the last quarter of the year (especially October) for a very good reason. In order to commence the fall harvest, farmers need to get the financing necessary to buy the tools to harvest crops and then ship the goods to cities and towns across the nation. Unfortunately, when one farmer needs funding to harvest crops so does a massive number of other farmers. The excessive demand for financing to feed a nation becomes a matter of national security. For this reason, various governments have taken to subsidizing the needs of farmers when banks and financial markets couldn't, can't, or won't. One of the most popular arrangements was known as a farm loan system.

One of the earliest forms of farm loan programs was called Landschaften and was instituted by Frederick II of Prussia after 1750. In this program, the equivalent of corporate farmers banded together by merging their adjacent lands and then issuing a bond using the value of the land as collateral. Interest on the bonds would be paid based on the income generated on the sale of the commodity grown on the land. Financial panics would ensue if, for example, there was an unwilling market for the bonds being sold or if there was too much or too little of a crop being brought to market.

Later iterations of a government sponsored program intended to support farmers was Credit Foncier (English version of website is here). Established in 1852 by Napoleon III, Credit Foncier was specifically chartered to aid the financing of farmers and then needs. Foncier was known as a mortgage bond bank because it securitized the bonds based on the value of the farm land. As an organization that, although not part of the government, had the implicit backing of the government allowed for significant influence. Such influence allowed Credit Foncier to expand well beyond meeting the needs of farmers. After some time, Credit Foncier started to providing a majority of their loans to communes and homeowners in Paris.

In my research of Credit Foncier, I found the following quotes from the New York Times to be quite revealing:

"In 1848, when specie payments were suspended at the Bank of France, one of the pet inflationist projects was such a society as the Credit Foncier, whose obligations to the public should take the form of compulsory paper money."

"But although made a legal tender [money issued by Credit Foncier] in all payments, duties on imports and the public debt not excepted, being inconvertible into specie and issued without regard to quantity, they all become utterly worthless."

“The Credit Foncier of France.” New York Times. June 12, 1876.

In seems interesting to me that Credit Foncier was intended to help inflate the financial system through the guise of helping farmers, but later inflated into oblivion the very "legal tender" that they had control over.

Another type of farm lending institution was known as Credit Agricole. Credit Agricole was unique in that it was advanced money from the government of France to give loans to farmers. When Credit Agricole ran out of the money that was advanced, the government would require the Bank of France to issue new money to Credit Agricole without charging interest on the injection of funds. Credit Agricole would then reprice loans, that had already been issued, with higher interest rates. Inevitiably, the more loans that were made the greater the loss that was incurred. Despite the fact that Credit Agricole was a increasingly money losing operation, when considering the merits of the situation, the New York Times had this to say:

"However, the system of Credit Agricole should be discussed in America, not so much from the standpoint of its defects in France as from the standpoint of the advisability of the American Government furnishing a subsidy to the farmer. In view of the facts, it is realized by those who have studied the subject on the ground in Europe that the advantages to be brought to the American farmer will consist of the ability to get plenty of the greatest possible convenience and at fair and reasonable but not abnormally low rates."

"Some Land Banks". New York Times. October 6, 1912

Credit Agricole, Credit Foncier and the Landschaften system were the early models of financing mechanisms set up to keep farmers well capitalized when the financial markets were not very accommodating. These models would later set the stage for what was thought to be the saving grace for farmers in America.

Farmers and farming has had a hallowed tradition in the U.S. Our government will stop at nothing to help America's farmers. In the past, it was believed that all farmers were necessary and vital to the economy. Currently, corporate farms are showered with funds to "help" them compete with foreign agribusiness. This tends to be at the exclusion of small farms, implying that not all farmers are valued in the same way.

In 1912, legislators began contemplating farm financing systems as a means to smooth out the panics and crashes in financial markets. Among those that were actively considered were the Credit Foncier, Credit Agricole and the Landschaften systems. Each approach had their own merit in the eyes of the legislators, and in fact all approaches would be applied to the American financial system initially for farmers and then later for homeowners.

It is no coincidence that the Federal Reserve Bank came along in 1913. It was built with the stated goal of providing safety and stability in the banking system with the use of monetary policy. Additionally, the Federal Farm Loan System (FFLS) was set up in 1916 to provide loans to the farming industry. Again, I cannot emphasis enough the point that the whole purpose of these institutions were set up to treat the symptom of recurrent panics and crashes associated with farming.

Despite the existence of the Federal Reserve Bank and the Federal Farm Loan system we still had a monumental crash of financial markets from 1929 to 1932. The answer to this reality was the creation of Reconstruction Finance Corporation (RFC) to clean up the foreclosure mess that followed the crash of 1929. With creation of the RFC, banks that should have failed due to imprudent lending practices were given a pass, chief among them were National City Bank also known as Citigoup (C).

Later, as part of the New Deal laws that were passed in 1938 (not so new by then), the Federal National Mortgage Association (Fannie Mae) (FNM) was created based on the Federal Farm Loan System concept which in turn was based on the Credit Foncier, Credit Agricole and Landschaften models. Later iterations of the same flawed farm subsidies applied to homes were Freddie Mac, Ginnie Mae, FHA and a whole host of programs.

The problem with constructing a housing system based on failed farming finance programs is that it never worked without the subsidies. In the case of housing, prices would fall tremendously if it weren't for the fact that interest deductions are given and that Fannie, Freddie (FRE), GNMA, VA, and FHA will buy up or guarantee mortgages so that banks can keep lending. Additionally, first time homebuyer incentives are liberally offered and have always been offered as indicated by the state housing finance agencies website.

Basically, the government schemes that currently exist to incentivize housing, will only ensure that we continue to have financial panics and crashes with variable winners and guaranteed losers. Having Glass-Steagall in place only marginally affects the inevitable outcome. In fact, the fallout from subsidizing the housing market was going to happen anyway. It just happen to coincided with the fact that Glass-Steagall wasn't in place.

Parenthetically, although Glass-Steagall officially died in 1999 when signed into law by Clinton, it was dead on arrival when Swiss Bank announced that was going to buy investment bank Dillion, Reed & Company on May 15, 1997. The Clinton signing the Graham-Leach-Bliley Act was merely a formality as noted in my posting on March 30, 2009. -Touc

Related Articles:

Sources:

  • Conant, Charles A. “Putting the Farmer in Command of Ready Money.” New York Times. September 8, 1912.
  • “The Credit Foncier of England—Another Exposure.” New York Times. August 6, 1868.
  • “The Credit Foncier of France.” New York Times. June 12, 1876.
  • Some Land Banks. New York Times. October 6, 1912.

Nasdaq 100 Watch List

Article Flashback: April 20, 2009

Below is my response to a critic of my April 20, 2009 article about how past management of the Dow Jones Industrial constituents had contributed significantly to the declines in the market from 1929 to 1932. I feel that this response is so instructive about stock indexes and the crash of 1929 that all my new readers should see it again for the first time.

According to this critic (SivBum) the purpose of an index is, "not to pick stocks with strength but to reflect the overall market place."

My response was the following:

"I completely agree with your comment that the purpose of the index isn't to pick stocks with strength but to reflect the overall market. However, you need strong companies to last long enough to actually reflect the market. Otherwise, the companies chosen would go out of business and then have to be be replaced. As you'll see below, many other stocks that went in and out of the index never were either obsolescent or bankrupt.

Although AIG has been nationalized it conceivably could still be in the index. After all, even though the railroads were nationalized in 1914 they still were part of the Dow-Jones Transportation Index.

Regarding changes to the Dow it should be noted that many companies have been added and dropped in the fashion of an inexperienced trader. Here are some notable examples:

  • American Tobacco was dropped in 1899 and added in 1924, was dropped in 1928 and replace with the American Tobacco B shares, B shares were dropped in 1930
  • General Electric was dropped in 1898, added in 1899, dropped in 1901, added 1907.
  • IBM was added in 1932, dropped in 1939, added in 1979
  • International Paper preferred shares were added in April 1901, dropped July 1901, common shares were added in 1956, dropped in 2004.
  • Remington Typewriter was added in 1925, dropped in 1927
  • Texaco or Texas Company was added in 1916, dropped in 1924, added in 1925, dropped in 1997.
  • Goodrich was added 1916, dropped in 1924, added in 1928, dropped in 1930.
  • Coca Cola was added in 1932, dropped in 1935, added in 1987.

The evidence seems to indicate that the managers of indices act like traders rather than trying to reflect the overall economy or market."

I have to thank the critics on Seeking Alpha for forcing me to go the extra mile in my research to make an even better point than I had set out to. Touc.


Please revisit Dividend Inc. for editing and revisions to this post.

Nasdaq 100 Watch List

Cardinal Health (CAH): Right on Target

Like a bevy of bobby sock teenagers chasing their heartthrob crooner, analysts and reporters are falling all over themselves to point out the glowing earnings forecast of Cardinal Health (CAH.) Even the Cramer folks were crooning about CAH, too bad they're charging for information ex post. Any surprise to us? Naw, my June 4, 2009 research recommendation pointed out the obvious at a time when it was most useful to you. At the time, I was so stunned by the quality of the company I went so far as to say:

"Either the books are being cooked or this stock is ridiculously underpriced."

I went out on a limb with that remark but it was clear that, with a company that had increased its dividend every year for 12 years in a row, the quality of earnings wasn't an aberration. Just my luck, I issued a sell recommendation on July 29th. After all, I'm in pursuit of "fair profits" rather than holding and hoping. I love to sell my stocks to a frantic buying public. Rereading my June 4th post has a lot of insights that might be useful for new readers to my blog.

Again, research recommendations are meant to alert investors to potential long term opportunities while sell recommendations are intended to deal with the short term reality of the market. Touc.

Please revisit Dividend Inc. for editing and revisions to this post.